This site offers a huge assortment of maps and charts that put recent precipitation and temperatures in a climate context. Maps show how current conditions compare to Normal (long-term averages) for various time periods for the United States. Some data maps show data for the whole globe.
Where do these data come from?
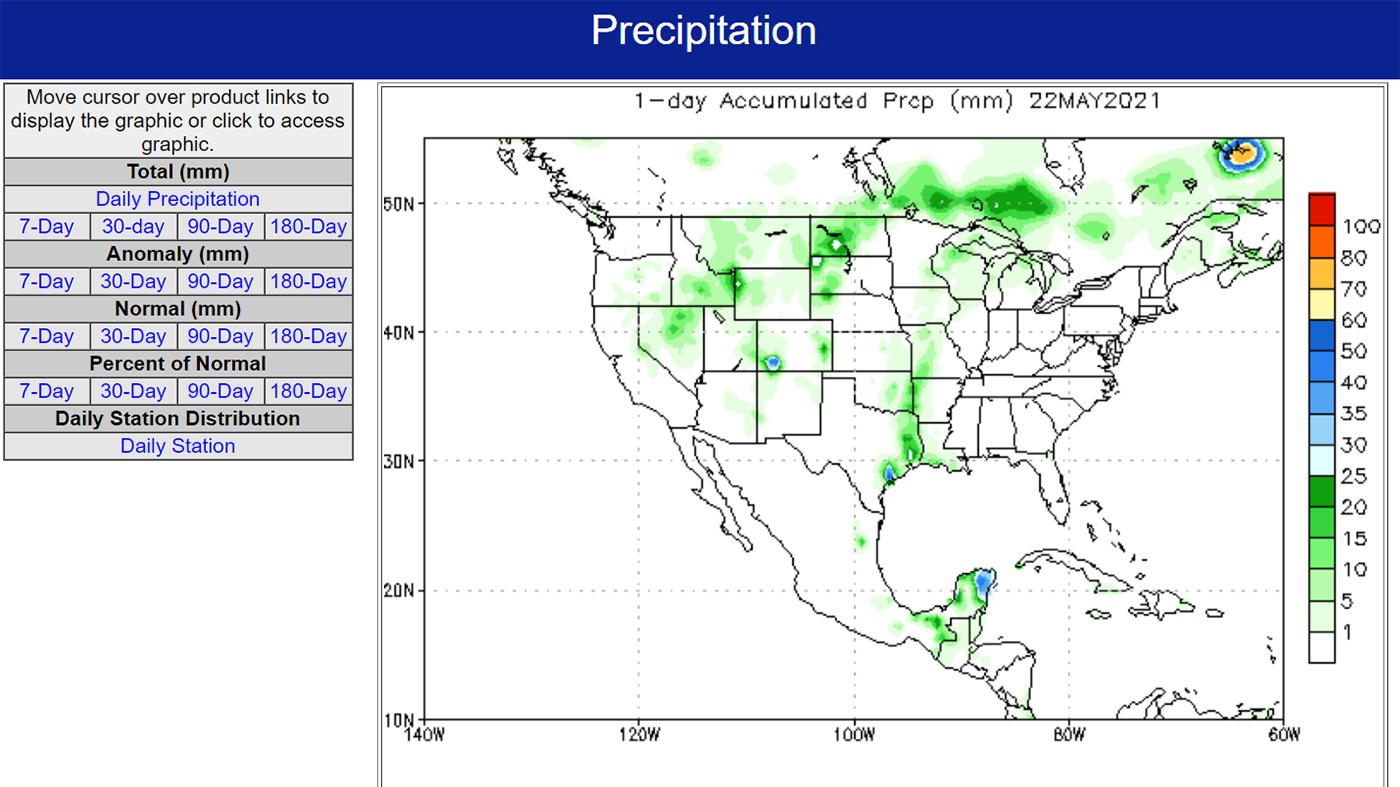
Precipitation data are from CPC's Unified Precipitation Analysis (based on rain gauges and gridded sampling). Temperature data are from River Forecast Centers and Climate Assessment Data Base. 1981-2010 climatologies ("Normals") are used to calculate anomalies.
-
What can I do with these data?
- Explore maps that show how recent precipitation and temperture compare to their long-term average values (also know as Normal).
- For precipitation, explore maps of total precipitation, Normal precipitation, Anomaly (difference from Normal), and Percent of Normal.
- For temperature, explore recent minimum and maximum temperatures, and how they differ from Normal minimum and maximum temps from 1981-2010.
How do I use the site?
Click a link of interest and follow instructions to view specific products.
-
Data Format(s)Other
Access Type Link & Description Mapping Access to a range of maps, time series, and tables of U.S. and global precipitation, temperature, and other climate variables at various intervals, back at least a year. -
Collection of daily and monthly data, time series, and maps for various climate parameters, such as precipitation, temperature, snow cover, and degree days. Precipitation maps include the Palmer Drought and Crop Moisture Indices. Most of the information is presented by climate division.
-
Data TypeLand-based stationEssential Climate VariablesAir temperature,Science OrganizationClimate Prediction Center
 Click to see more detail