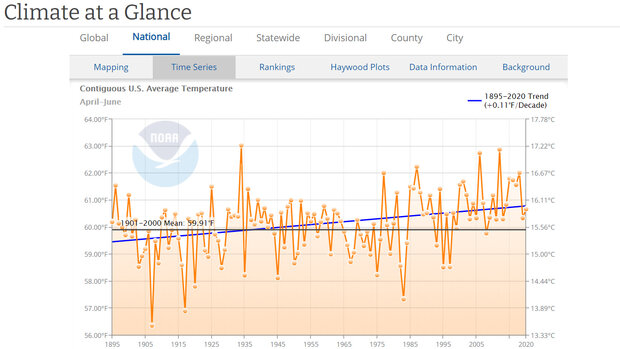
Historical records of temperature and precipitation give you a way to see how they have changed over time. You can generate graphs showing temperature, precipitation, and other parameters for areas as large as the entire contiguous United States to as small as a single city (data are available for almost 200 selected cities).
Where do these data come from?
Temperature and precipitation are recorded at regular intervals at weather and climate stations across the country, both through manual observation and by automated instruments. After these data are compiled and quality checked, they are included in various databases. The U.S. Climate Divisional Database provides the data for statewide, regional, climate divisions, and agricultural divisions in this graphing tool. City data are from the U.S. Historical Climatology Network (USHCN) and the Global Historical Climatology Network (GHCN).
-
What can I do with these data?
- You can select and graph different parameters for a selected state, city, region or climate division and compare trends for different time periods.
- After plotting the desired data, you can copy a permalink for the graph.
How do I use the site?
Use the pull-down menus to select your options of interest:
- Parameter – Temperature or Precipitation
- Time Scale and Month
- Start and End Year
- State/Region and Climate Division/City
- Plotting and Display Options
 Click to see more detail
