Searching for Data
Data searches can be frustrating... These strategies may help you find what you're after. As with any searching strategy, it's good practice to begin with some simple questions to narrow your search.
Strategy 1: Find Prepared Maps, Graphs, or Data Tables (tabular data)
Are you looking for a graph or a table of data, or would you prefer to see a map? Weather and climate data are generally presented in one of two forms: time-based data, also known as temporal data, and space-based or spatial data. When looking for data, ask yourself
- Am I looking for temporal data? Do I want the same type of measurement made again and again at the same place over time?
- Am I looking for spatial data? Do I want the same type of measurements made at various locations across a map?
Time-based (temporal) data
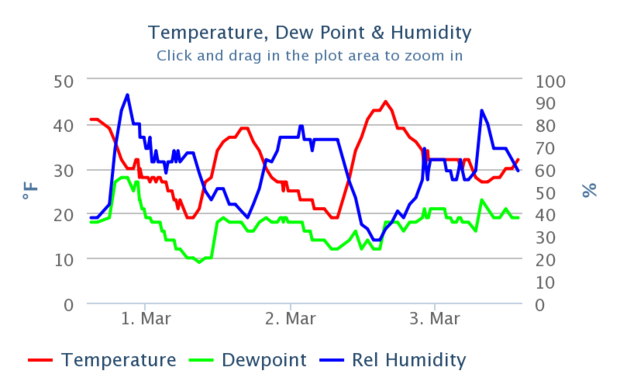
Hourly weather graph for Hailey ID
Image source: NWS Pocatello
Time-based, or time series data, shows change over time. The time period examined can be from minutes to years or longer. For example, think of your daily temperature, how did it change today? In this case you would want a graph with time on the x-axis and temperature on the y-axis.
Maybe your question is about looking at temperature patterns for one location over a period of many years. Once again, you would be looking for time-series data. An example of this type of data is available from the U.S. Historical Climate Network (UHHCN) through the Carbon Dioxide Information Analysis Center.
Map-based (spatial) data
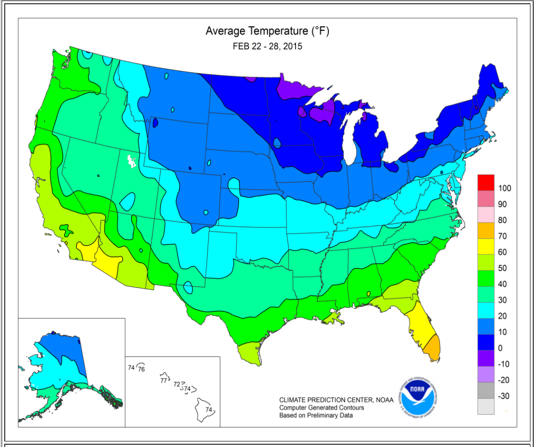
February 2015 Temperatures
Image Source: NOAA CPC
Another method of thinking about data is spatial, or map-based data. This style of data presentation allows users to explore and investigate data patterns over an area – from a local region to the world. For instance, we commonly visualize daily temperature and precipitation patterns using maps.
Maps allow users to step back and see the big picture of relationships between geography and weather. Examples of map-based data include cloud cover, precipitation, and temperature. Other data often presented in map form include: forest fire potential, hurricane tracks, and vegetation status.
Strategy 2. Explore the Types of Data Available in NOAA Visualization Tools
An easy way to begin a data search is to look around at existing data products
- NOAA View
- Climate Data Online
- NOAA Weather and Climate Toolkit
- NOAA Climate Explorer
- NCDC Climate at a Glance
Strategy 3. Explore the Types of Data Available by Browsing or Filtering
If you're not sure what data you are interested in, browsing the Dataset Gallery can inspire ideas by showing you the types of data available.
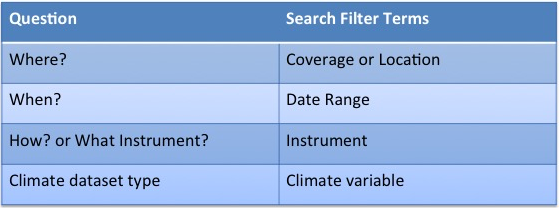
To begin searching for data, you can enter a term in the Search box. You can also filter the results by the following criteria, or combine criteria for an even narrower search.
- Filter by coverage (global, regional, state, …)
- Filter by location (ocean, land, polar, …)
- Filter by time period (historical, annual, monthly, …)
- Filter by instrument (satellite, weather station, …)
- Filter by climate variable (temperature, precipitation, wind …)


