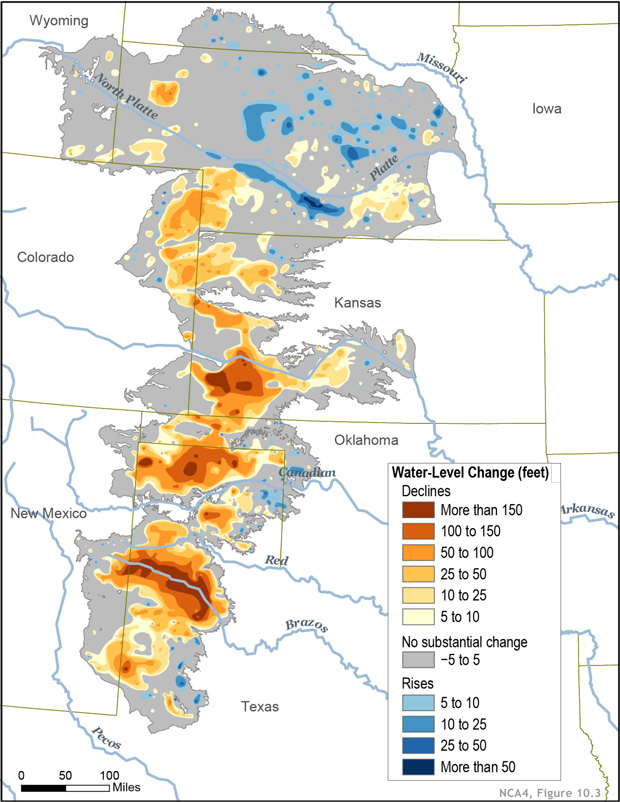
Image caption
This map shows changes in Ogallala water levels from before the aquifer was tapped to 2015. Declining levels are red or orange, and rising levels are blue.
This website is an ARCHIVED version of NOAA Climate.gov as of June 25, 2025.
Content is not being updated or maintained, and some links may no longer work.
This map shows changes in Ogallala water levels from before the aquifer was tapped to 2015. Declining levels are red or orange, and rising levels are blue.