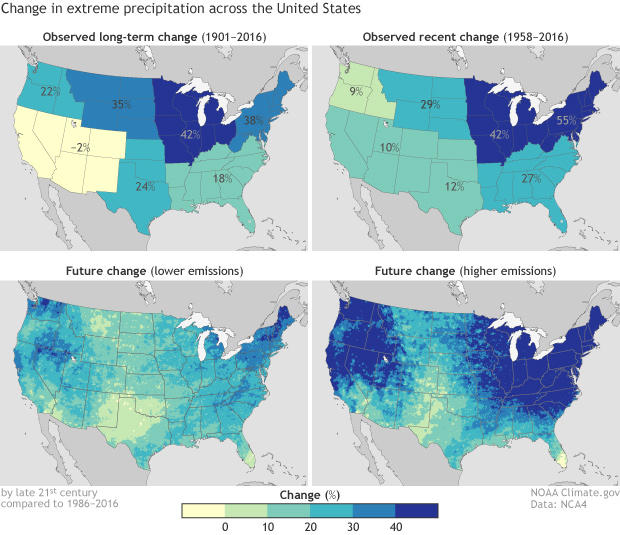
Image caption
These maps show observed (top row) and predicted (bottom row) changes in extreme precipitation in the United States. Bigger increases appear in darker colors.
This website is an ARCHIVED version of NOAA Climate.gov as of June 25, 2025.
Content is not being updated or maintained, and some links may no longer work.
These maps show observed (top row) and predicted (bottom row) changes in extreme precipitation in the United States. Bigger increases appear in darker colors.