
Image caption
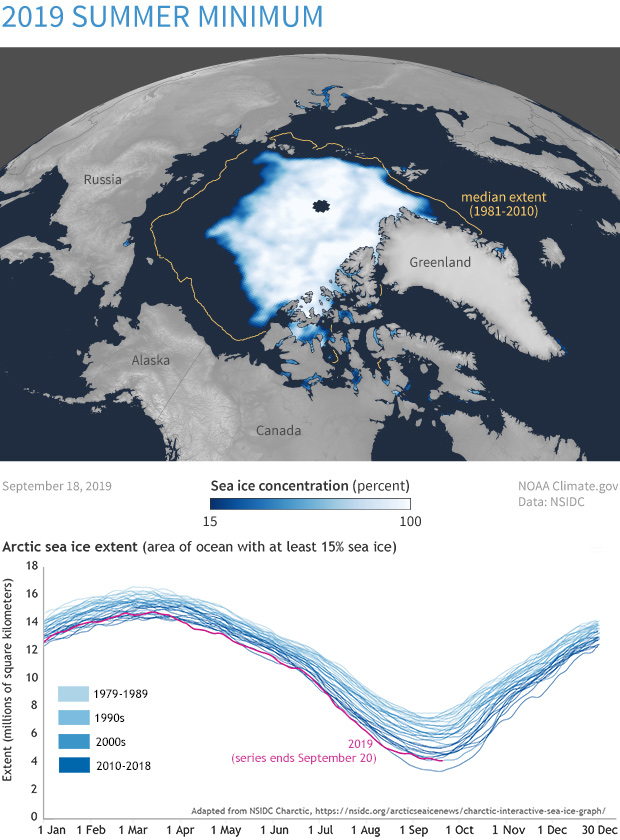
(top) Sea ice concentration (light blue to white) on September 18, 2019, the day of the summer minimum extent. (bottom) A graph of daily ice extent each year of the satellite record. Earlier years are in shades of light blue; recent years are in dark blue. The 2019 daily extent line is in dark pink. NOAA Climate.gov image, based on data from the National Snow and Ice Data Center.