
Image caption
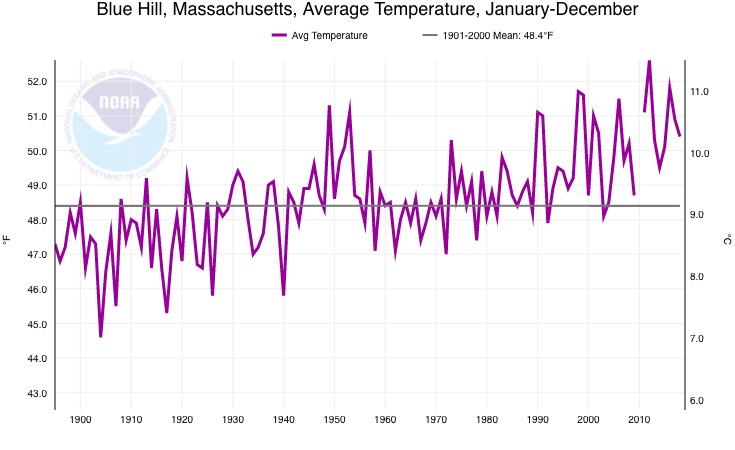
The purple line connects annual average temperatures observed at Blue Hill, Massachusetts from 1885 to 2018. Each annual average was calculated from a full year of daily averages of minimum and maximum temperatures. For comparison, the horizontal black line shows the overall average temperature at the station from 1901 to 2000. Image source: Climate at a Glance, NOAA.