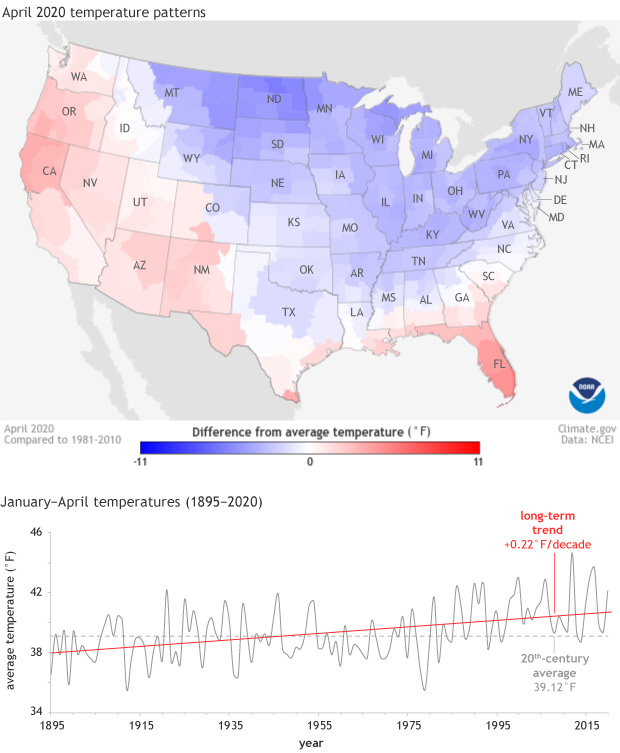
Image caption
(top) Temperature in April 2020 compared to the 1981-2010 average. (bottom) January-April temperatures for the contiguous U.S. each year from 1895-2020 (gray line), with the 1901-2000 average shown as a dashed gray line and the long-term trend as a red line.