
Image caption
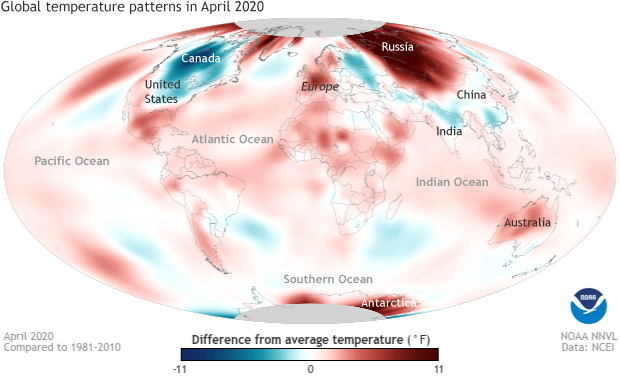
This global map shows where April 2020 temperatures were up to 11°Fahrenheit (6°Celsius) cooler (darkest blue) or warmer (darkest red) than the 1981-2010 average. Much of central Asia was extremely warm with temperatures over 11°Fahrenheit higher than normal. Climate.gov image from Data Snapshots, based on maps processed by NOAA EVL from NCEI data.