
Image caption
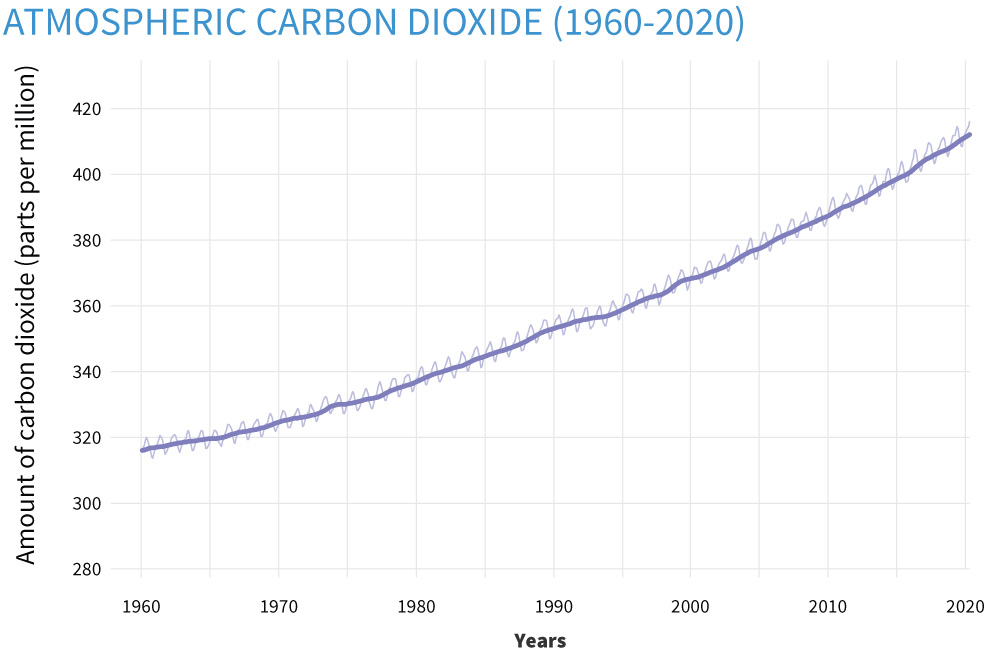
The thin line shows monthly average carbon dioxide at NOAA's Mauna Loa Observatory on Hawai'i in parts per million (ppm): the number of carbon dioxide molecules per million molecules of dry air. Over the course of the year, values are higher in Northern Hemisphere winter and lower in summer. The thick line shows the annual trend, calculated as a 12-month rolling average. Graph by Climate.gov based on data from NOAA Earth System Research Laboratories.