
Image caption
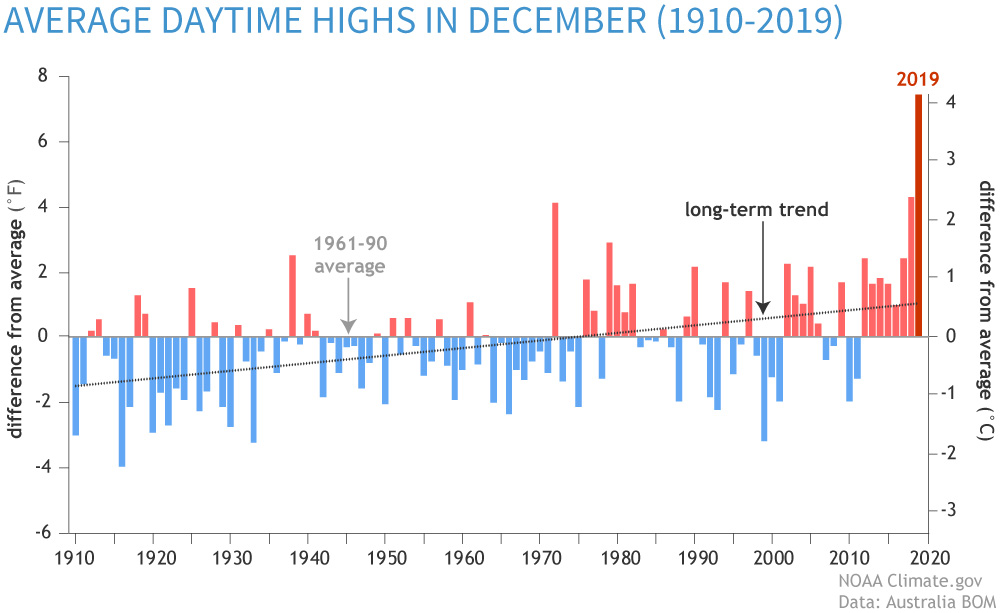
Average Australia December daytime highs show an increasing trend over 1910–2019. Temperatures below the 1961–1990 average appear as blue bars, and temperatures above the 1961–1990 average display as red bars. Graph by NOAA Climate.gov based on data from Australia Bureau of Meteorology.