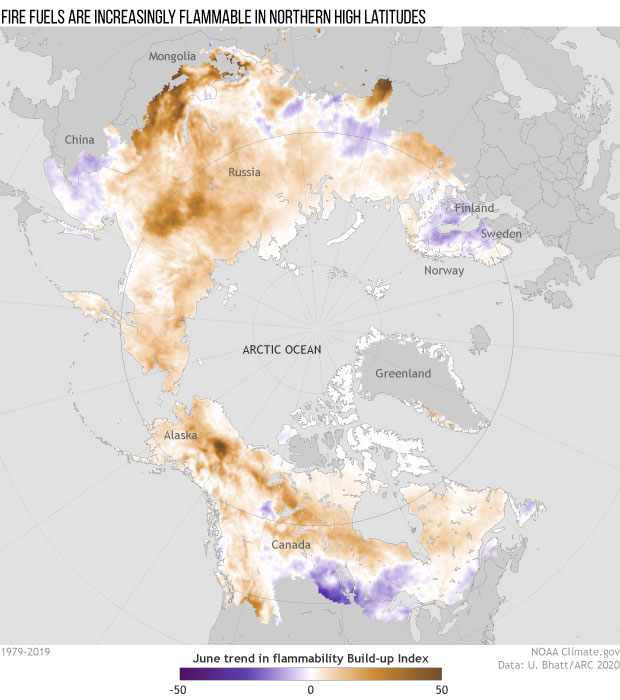
Image caption
Rising surface temperatures have made fire fuels in Northern Hemisphere high latitudes more flammable over the past 40 years. This map shows the June trend (1979–2019) in the Build-up Index, an element of the Canadian Forest Fire Danger Rating System that uses weather data to estimate the dryness of fuels. Brown indicates increasing flammability; purple indicates decreasing flammability. NOAA Climate.gov map, adapted from the 2020 Arctic Report Card. Full story.