
Image caption
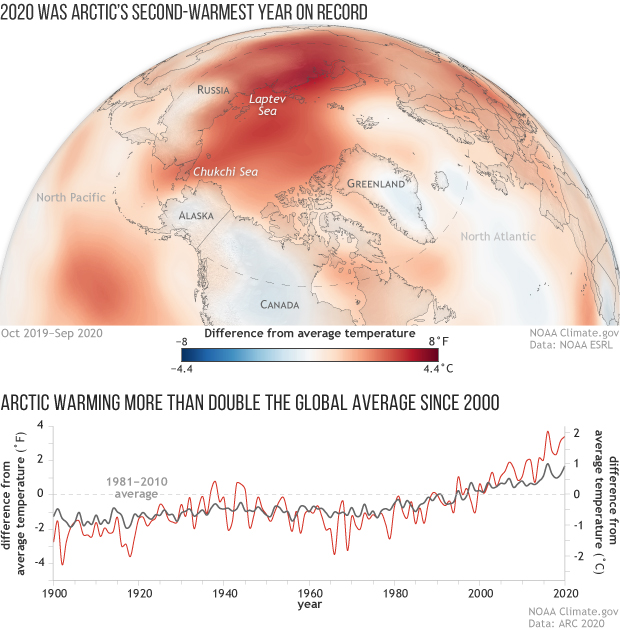
(top) Near-surface air temperatures across the Arctic from October 2019–September 2020 compared to the 1981-2010 average. Most of the Arctic was warmer than average (red), with only a few places colder than average (blue). Map by NOAA Climate.gov, based on NCEP/NCAR Reanalysis data from the Physical Sciences Lab at NOAA ESRL. (bottom) Annual temperatures over land in the Arctic (red) versus the globe (dark gray) compared to the 1981-2010 average from 1900–2020. Graph by NOAA Climate.gov, adapted from the 2020 Arctic Report Card.