
Image caption
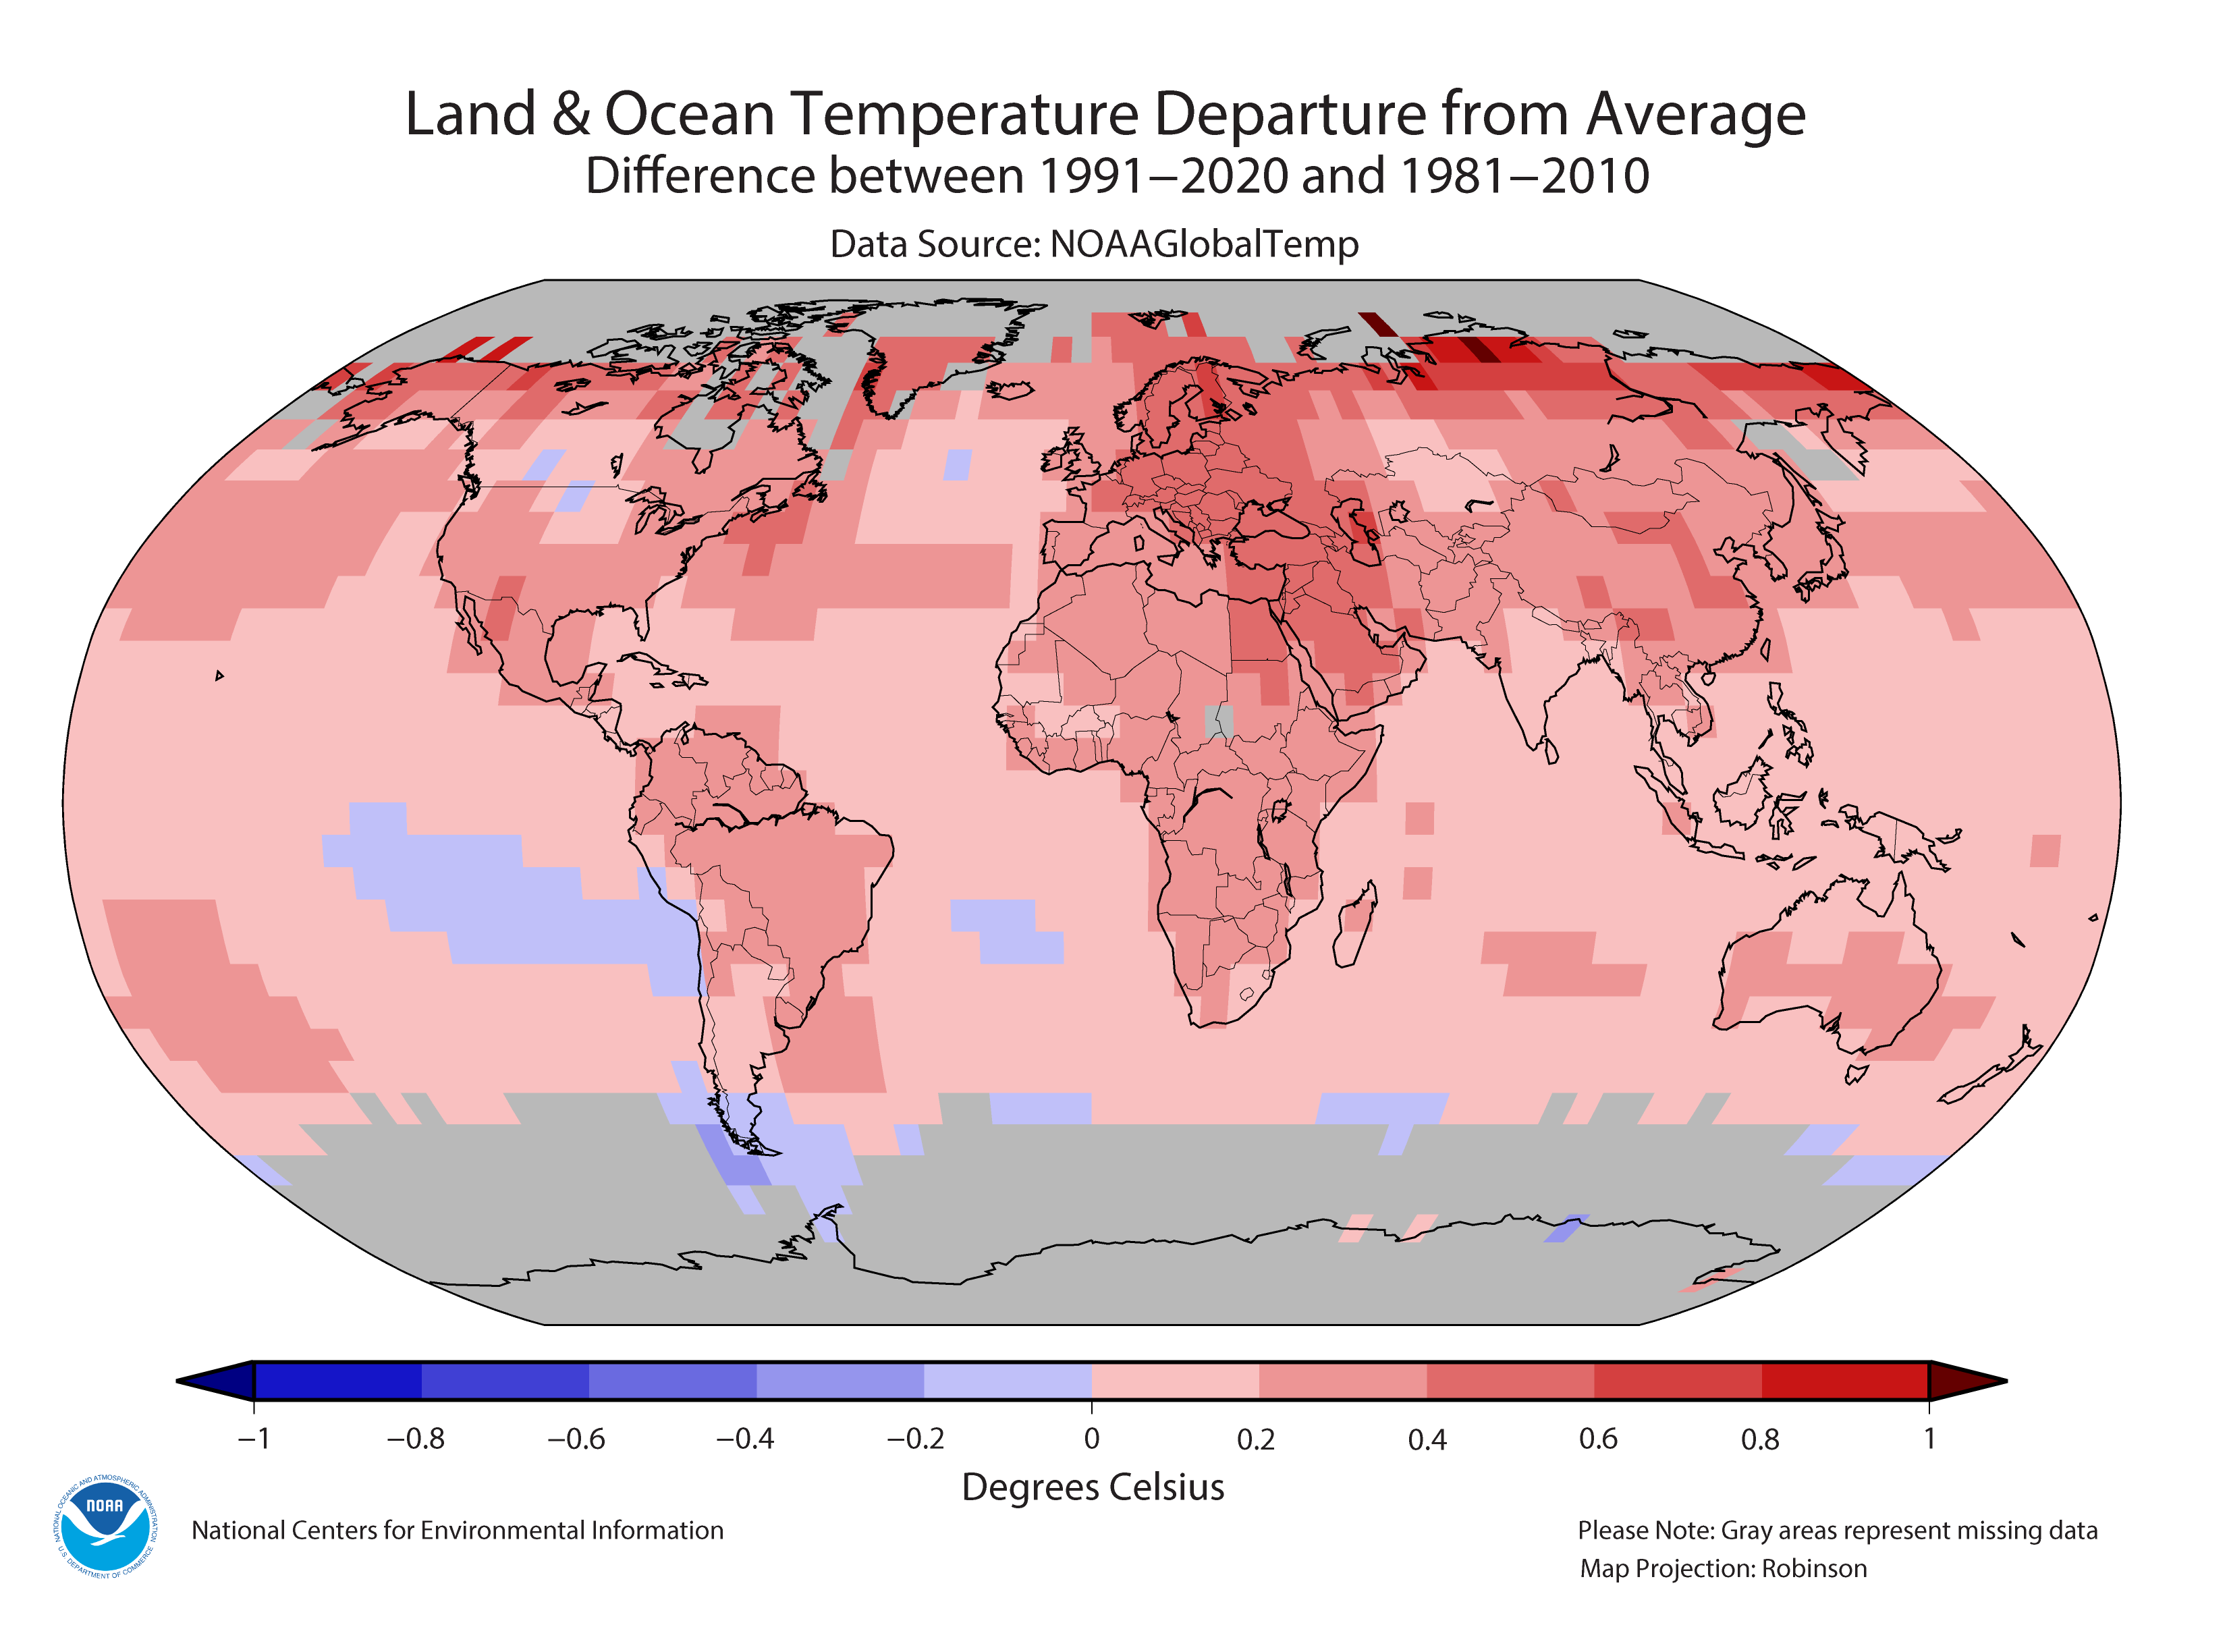
Annual mean temperature differences between the newer base period (1991-2020) and the older base period (1981-2010). Red shading indicates locations where the newer base period is warmer than the older one. Figure courtesy of Ahira Sanchez-Lugo (NOAA NCEI). Data from NOAAGlobalTemp.