
Image caption
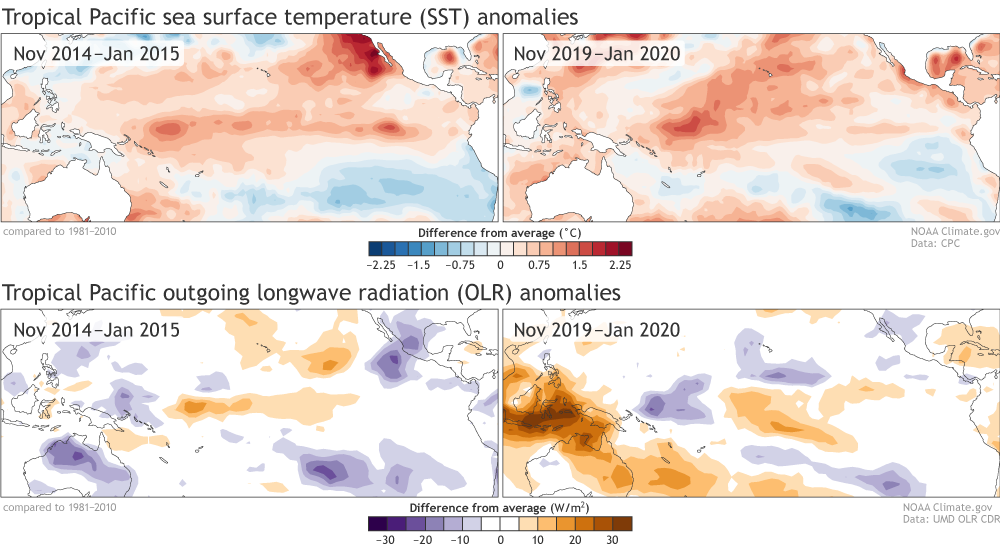
Anomalies (departure from average) of sea surface temperature (SST) and outgoing long wave radiation (OLR) for November 2014-January 2015 (left column) and November 2019-January 2020 (right column). Red shading indicates where SSTs are above average and blue shading is where SSTs are below average. Orange shading indicates where tropical cloudiness and rainfall is below average and purple shading is where tropical cloudiness and rainfall is above average. NOAA Climate.gov figure using data from NOAA CPC.