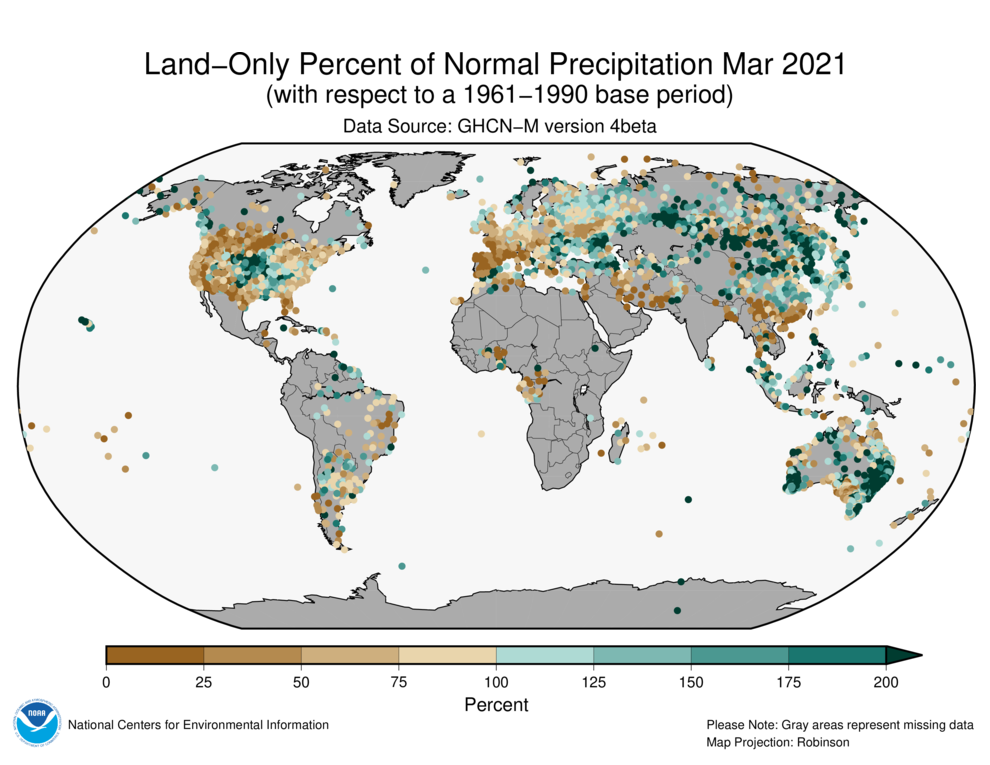
File name: GHCN_Mar2021_precip_lrg.png Original Resolution (pixels): 990 × 765 File Size: 936 KB (MIME Type: image/png) Date Published: May 7, 2021 Alternate Text: map of precipitation anomalies over land in March 2021 View image full size Download file Image caption Precipitation over land areas in March 2021 as a percent of the 1961-1990 average. Map by NOAA NCEI.
