
Image caption
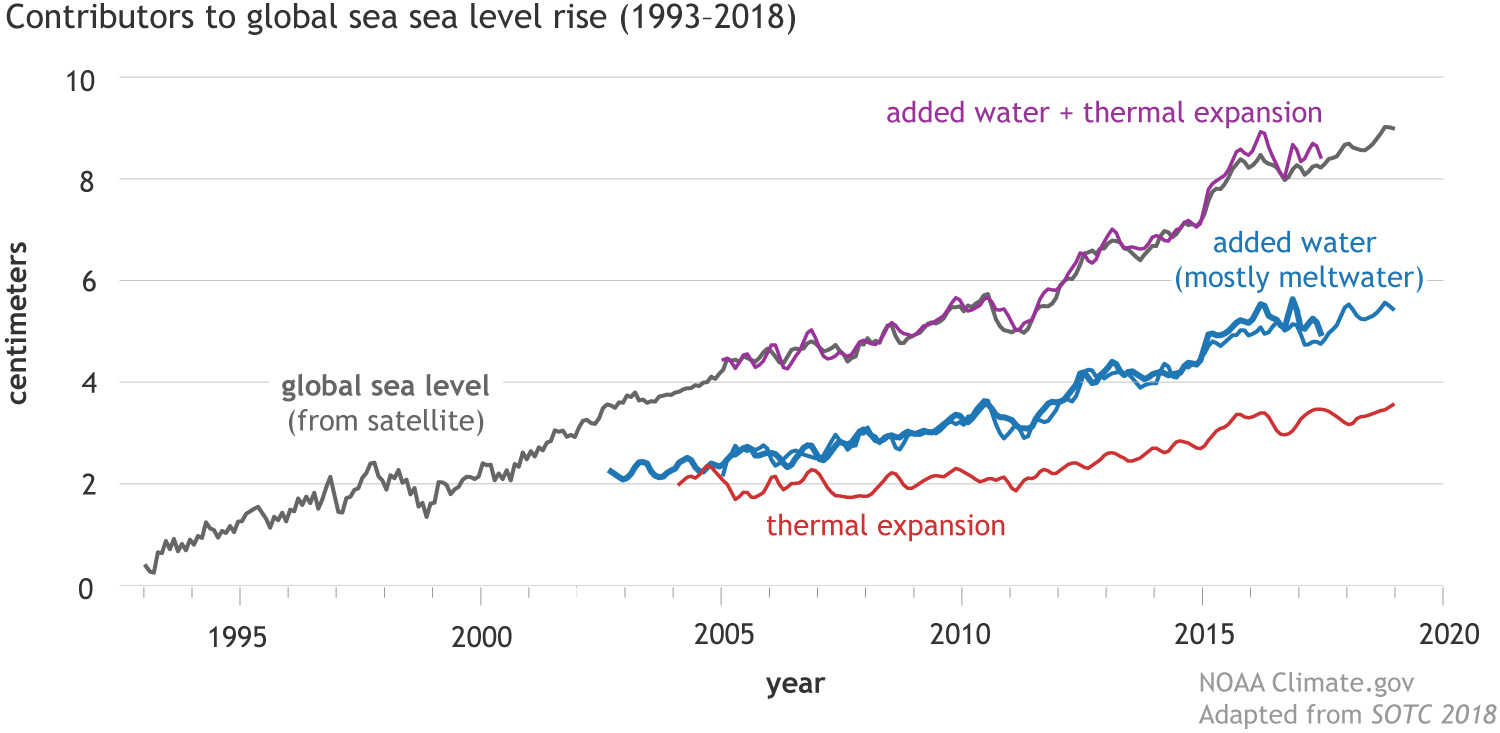
Observed sea level since the start of the satellite altimeter record in 1993 (black line), plus independent estimates of the different contributions to sea level rise: thermal expansion (red) and added water, mostly due to glacier melt (blue). Added together (purple line), these separate estimates match the observed sea level very well. NOAA Climate.gov graphic, adapted from Figure 3.15a in State of the Climate in 2018.