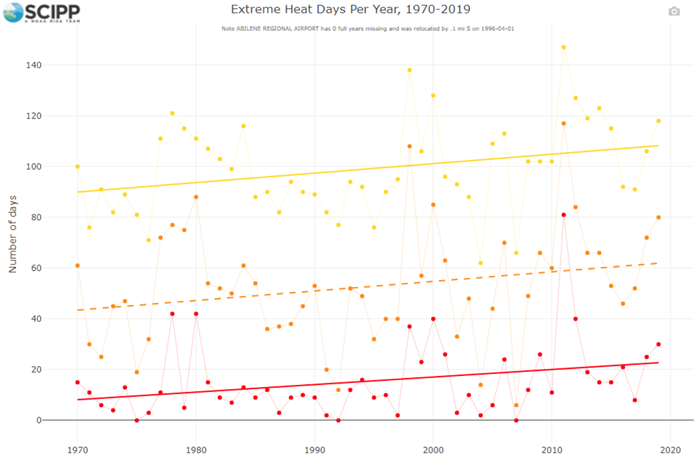
File name: may-25-2021-txdashboard.png Original Resolution (pixels): 700 × 467 File Size: 86 KB (MIME Type: image/png) Date Published: July 2, 2021 Alternate Text: Temperature dashboard graph View image full size Download file Image caption The temperature dashboard shows changes in the number of extreme-heat days per year. Credit: SCIPP
