
Image caption
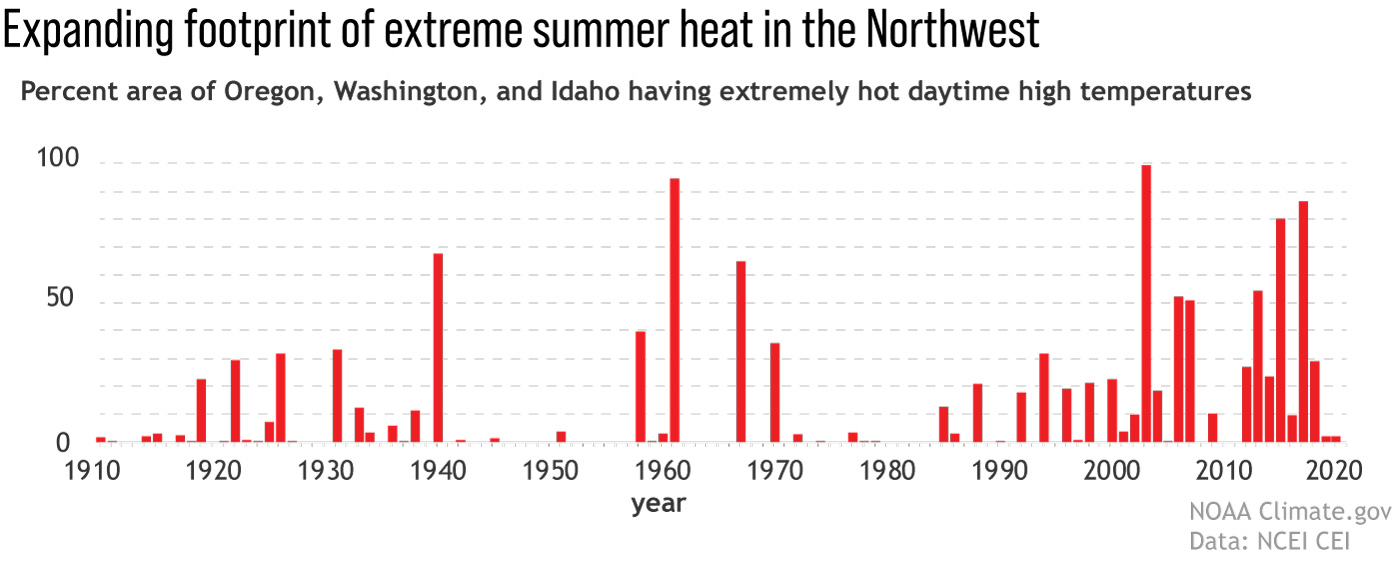
Red bars show the percent of the U.S. Northwest (Oregon, Washington, and Idaho) having extremely warm days—daytime high temperatures in the top ten percent of the historical record—each summer from 1910–2020. The footprint of extreme heat in the has ballooned in the past 20 years. NOAA Climate.gov image, based on data from NOAA's Climate Extreme Index.