
Image caption
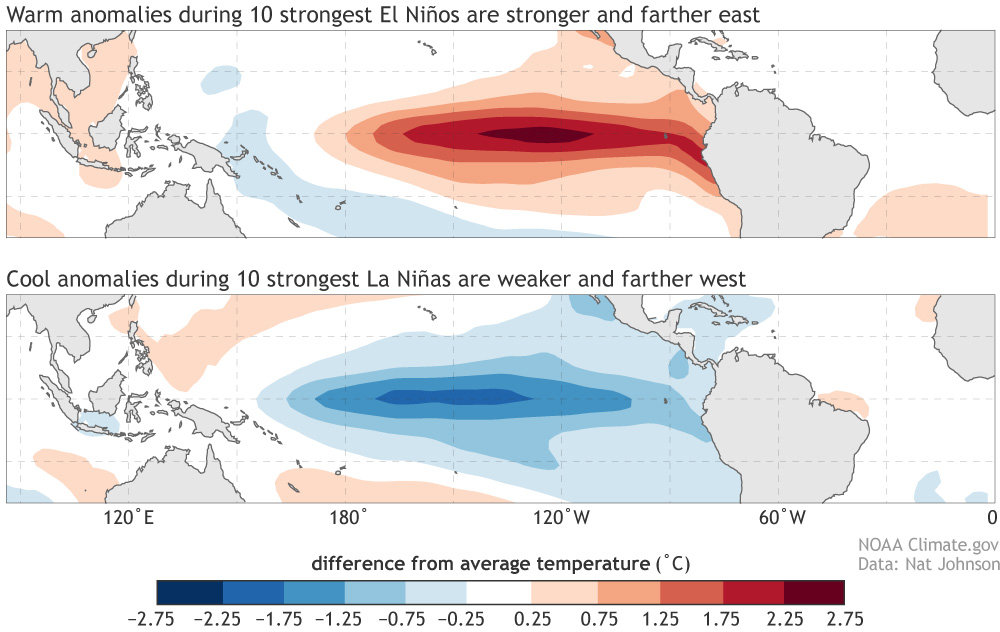
Average November – January sea surface temperature anomalies (°C) for the top 10 strongest (top) El Niño and (bottom) La Niña events since 1950 based on the November – January Niño3.4 index. Anomalies are calculated with respect to 30-year base periods updated every 5 years (see here for a description). NOAA Climate.gov figure with ERSSTv5 data obtained from the NOAA Physical Sciences Laboratory.