
Image caption
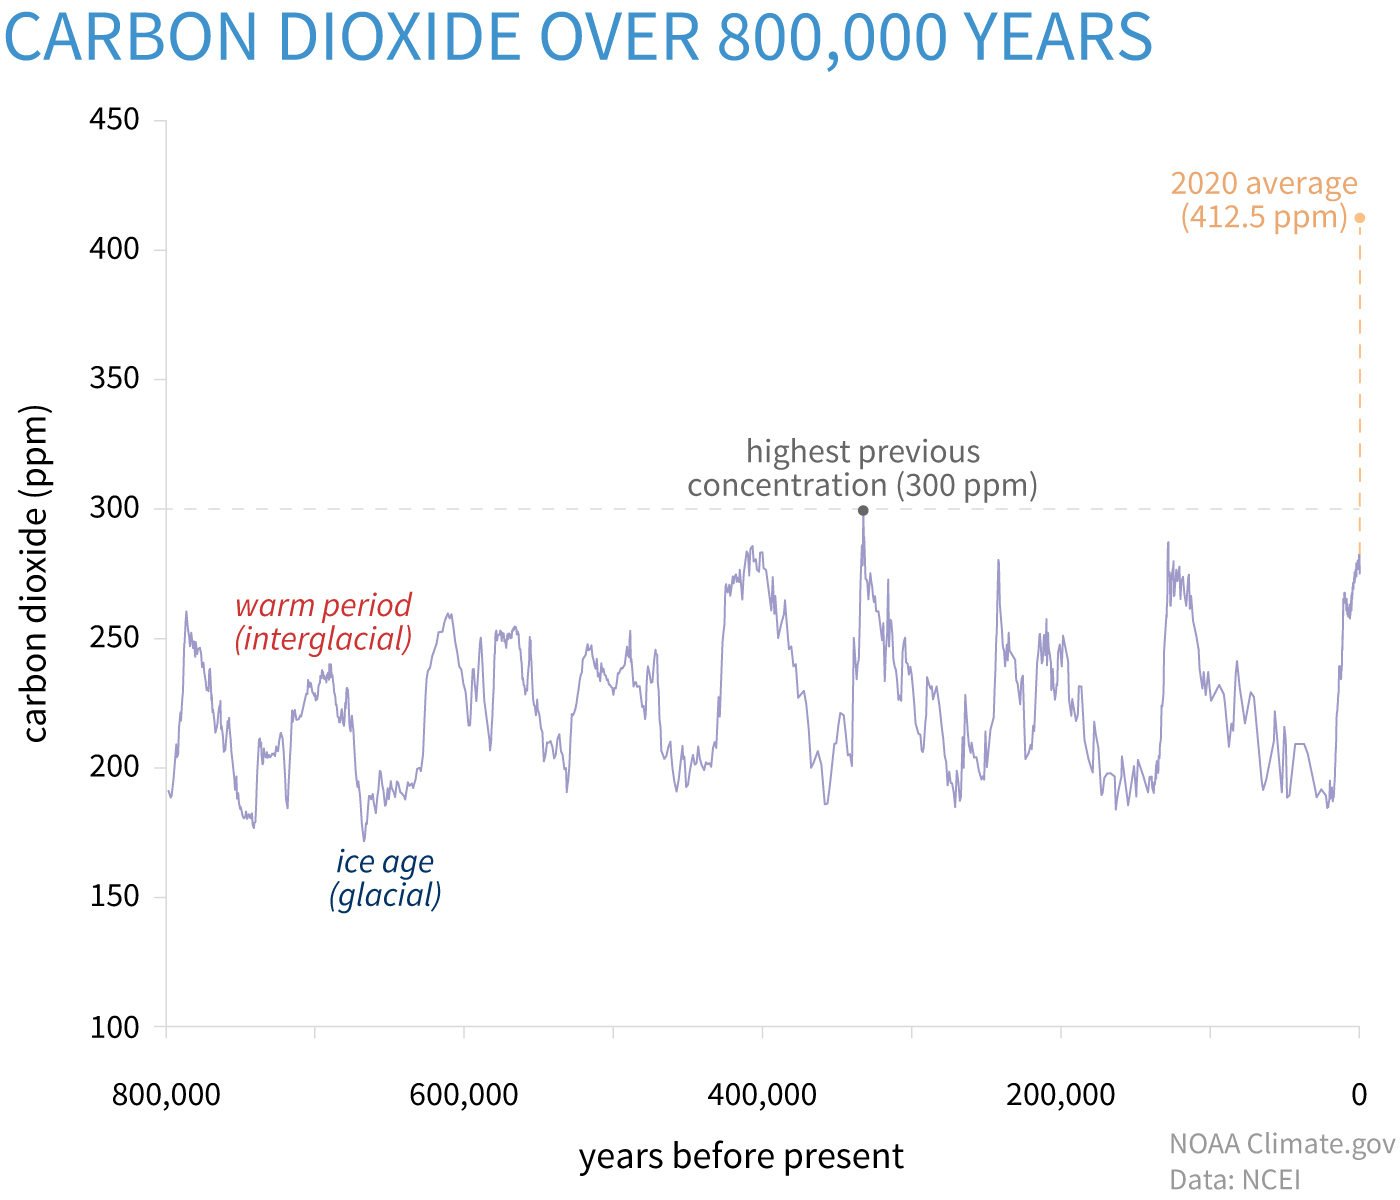
Global atmospheric carbon dioxide concentrations (CO2) in parts per million (ppm) for the past 800,000 years. The peaks and valleys track ice ages (low CO2) and warmer interglacials (higher CO2). During these cycles, CO2 was never higher than 300 ppm. On the geologic time scale, the increase (orange dashed line) looks virtually instantaneous. Graph by NOAA Climate.gov based on data from Lüthi, et al., 2008, via NOAA NCEI Paleoclimatology Program. [Correction: August 20, 2020. An earlier version of this image had an error in the time scaling on the X axis. This affected the apparent duration and timing of the most recent ice ages, but did not affect the modern or paleoclimate carbon dioxide values.]