
Image caption
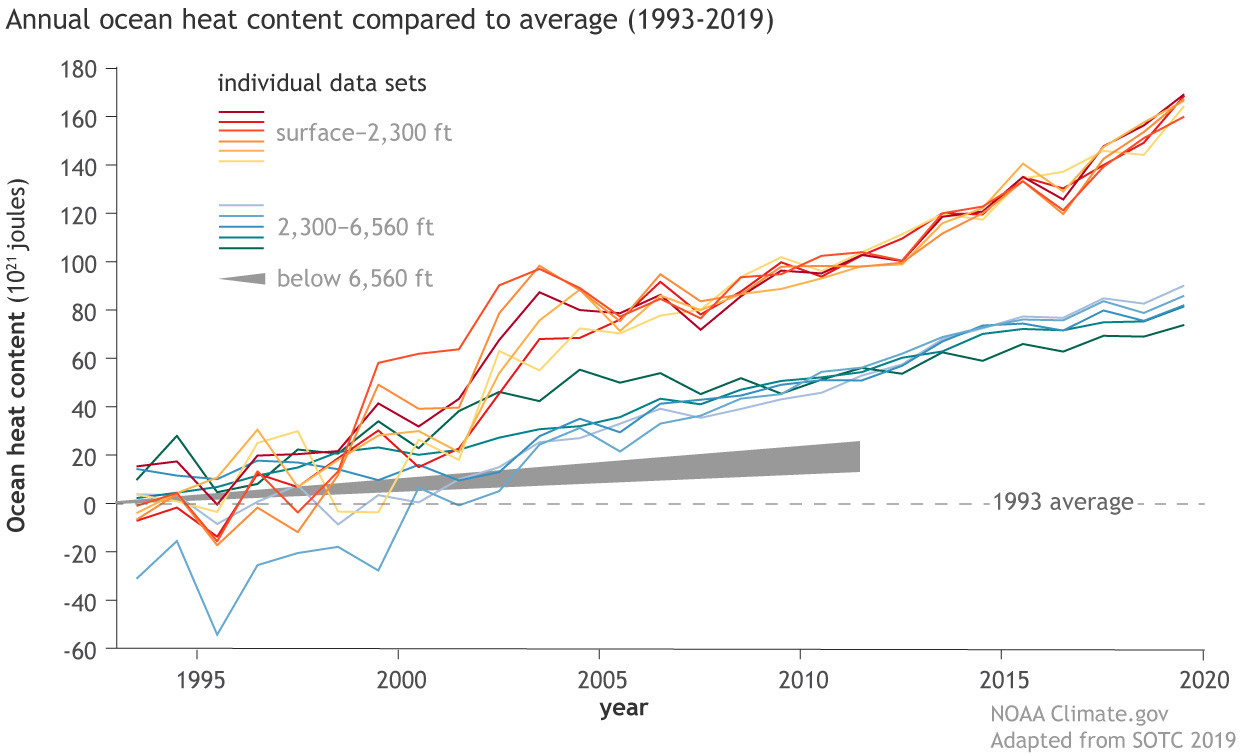
Annual ocean heat content compared to the 1993 average from 1993-2019, based on multiple data sets: surface to depths of 700 meters (2,300 feet) in shades of red, orange, and yellow; from 700-2,000 meters (6,650 feet) in shades of green and blue; and below 6,650 feet (2,000 meters) as a gray wedge. Graph by NOAA Climate.gov, adapted from Figure 3.6 in State of the Climate in 2019. See original figure for details about data sources and uncertainty.