
Image caption
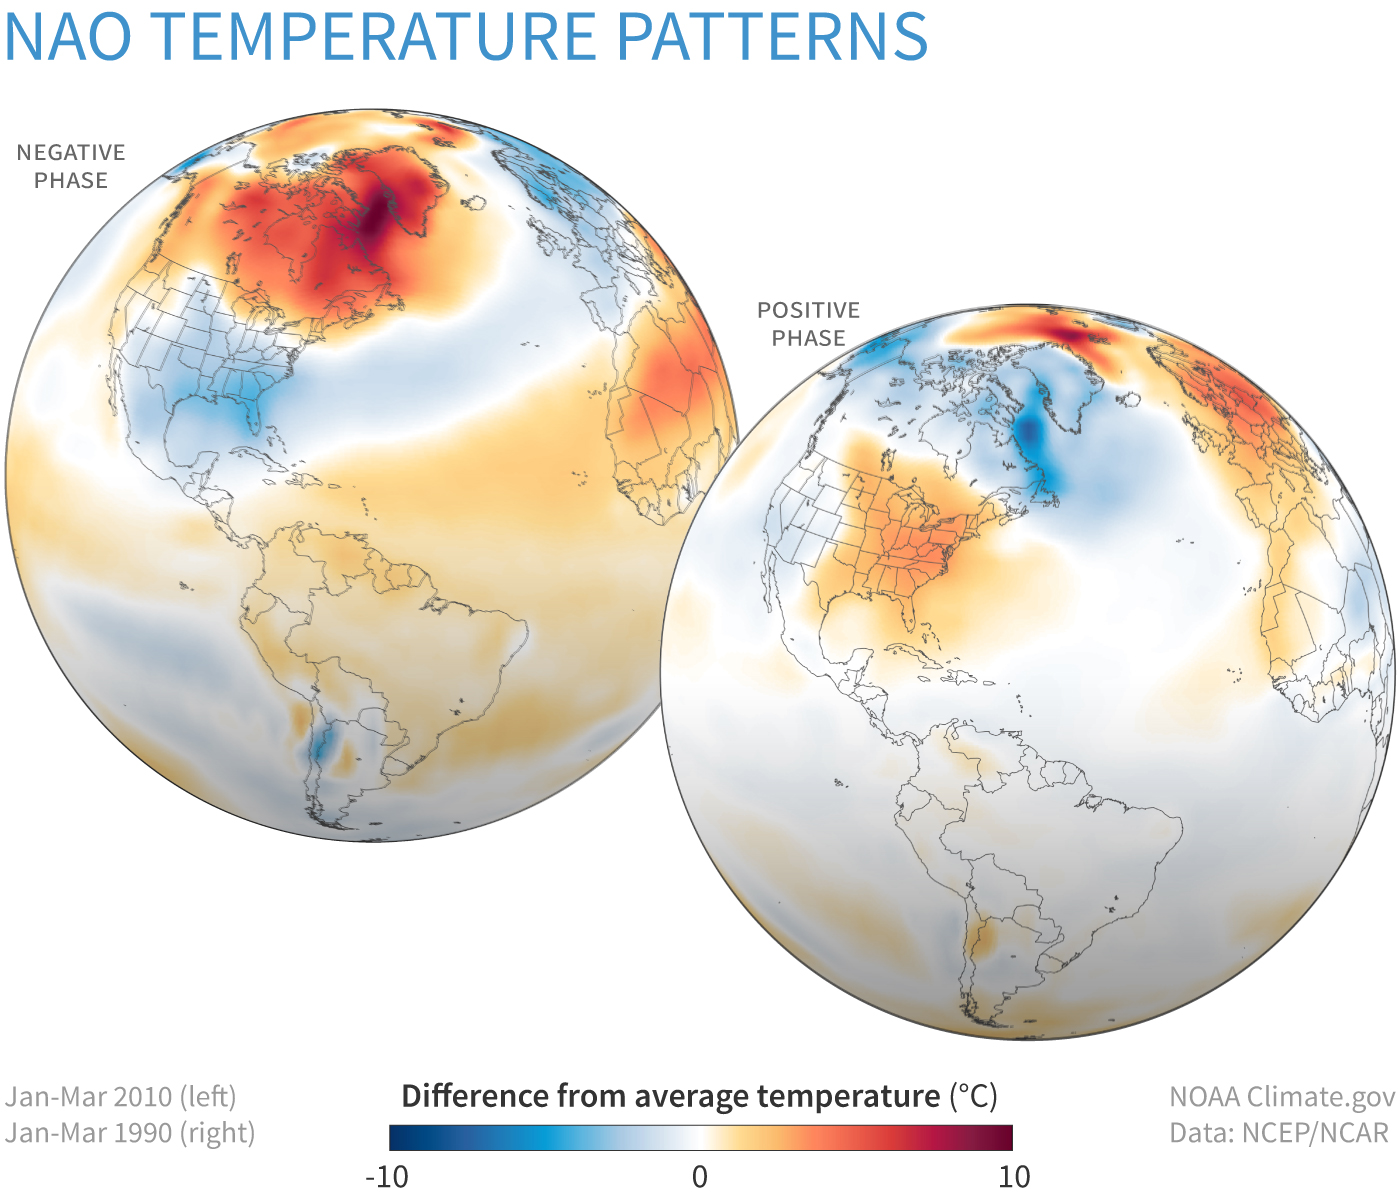
Late winter temperatures compared to the 1981-2010 average when the North Atlantic Oscillation (NAO) was strongly negative (top, Jan-March 2010) and when it was strongly positive (bottom, January-March 1990). Winters are often cooler than average across the mid-latitudes when the NAO is negative, and warmer than average when it is positive. NOAA Climate.gov image, based on data from the Physical Sciences Lab.