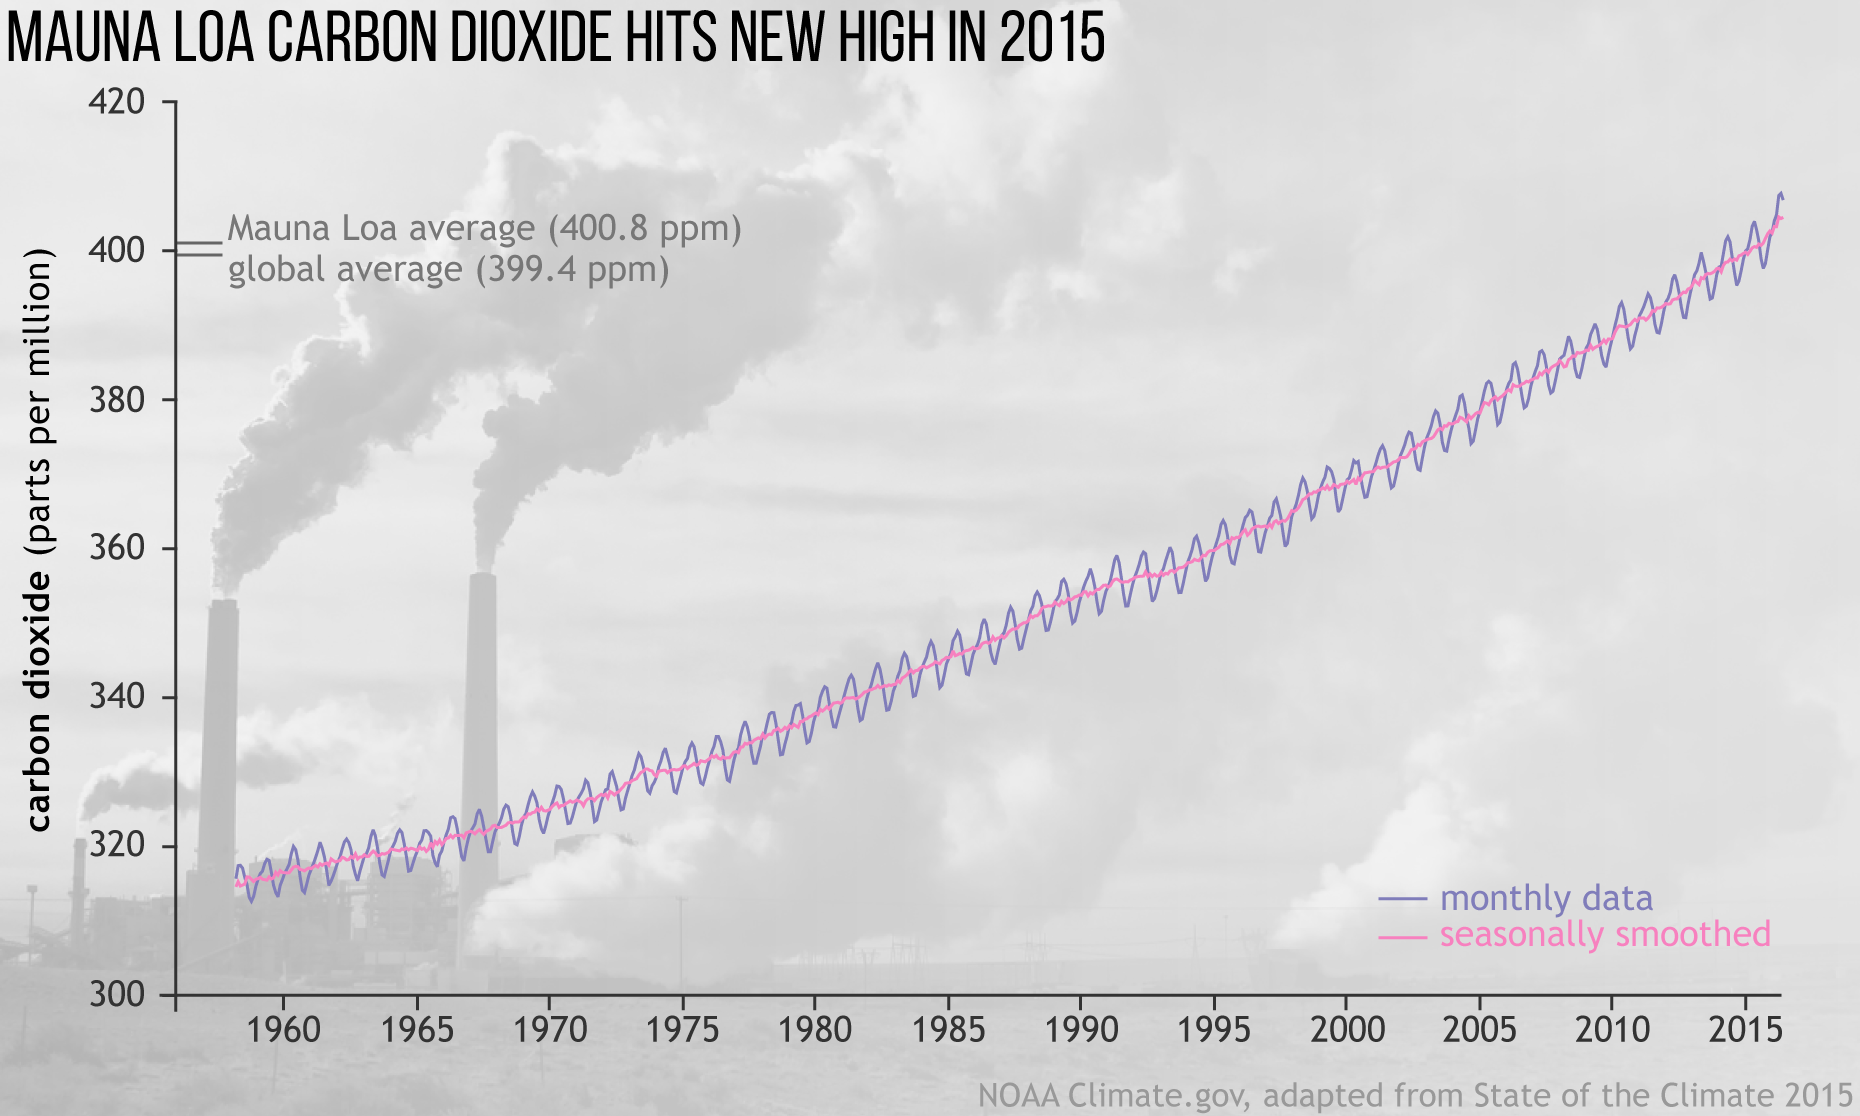
Image caption
Monthly average carbon dioxide amounts (blue line) measured at Mauna Loa observatory. The bright pink line shows carbon dioxide concentrations with the seasonal cycle smoothed out. Full story.
This website is an ARCHIVED version of NOAA Climate.gov as of June 25, 2025.
Content is not being updated or maintained, and some links may no longer work.
Monthly average carbon dioxide amounts (blue line) measured at Mauna Loa observatory. The bright pink line shows carbon dioxide concentrations with the seasonal cycle smoothed out. Full story.