
Image caption
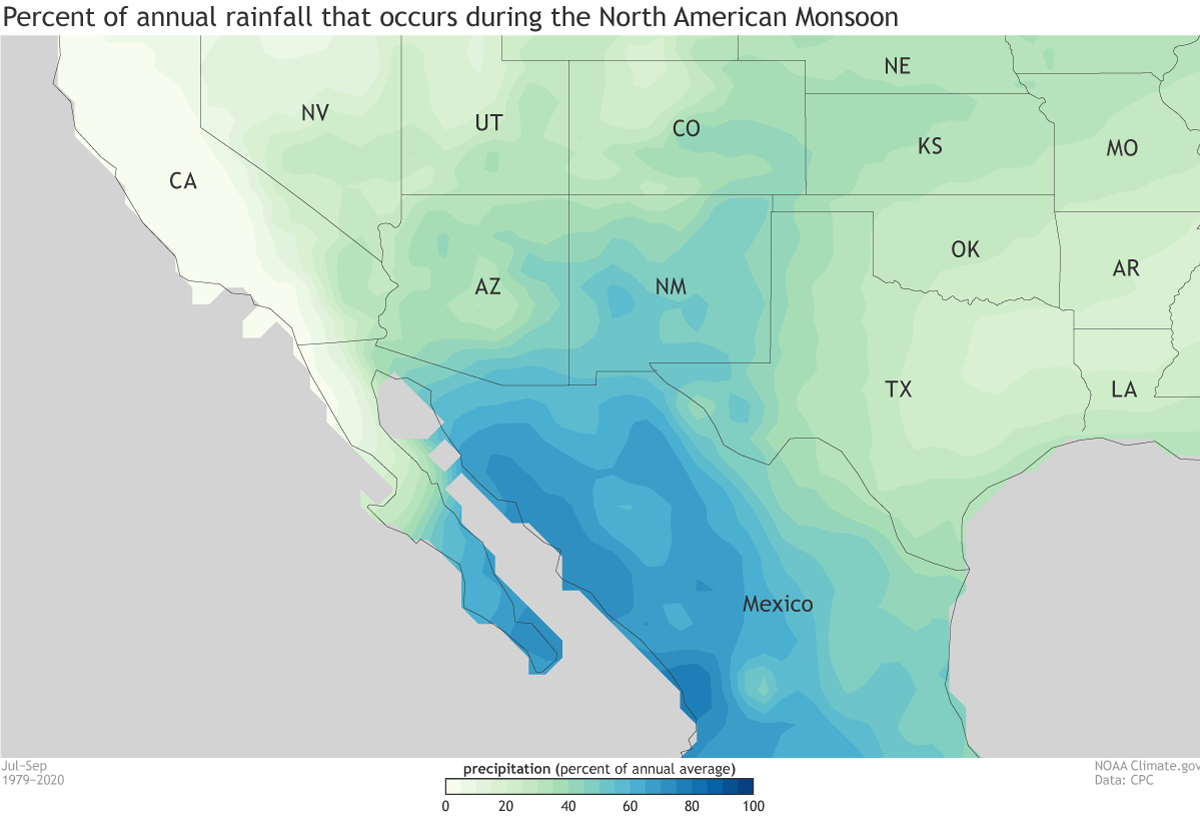
Percent of total annual precipitation occurring during July–September, based on 1979–2020 using CPC Unified rain-gauge-based data. Figure by climate.gov.
This website is an ARCHIVED version of NOAA Climate.gov as of June 25, 2025.
Content is not being updated or maintained, and some links may no longer work.
Percent of total annual precipitation occurring during July–September, based on 1979–2020 using CPC Unified rain-gauge-based data. Figure by climate.gov.