
Image caption
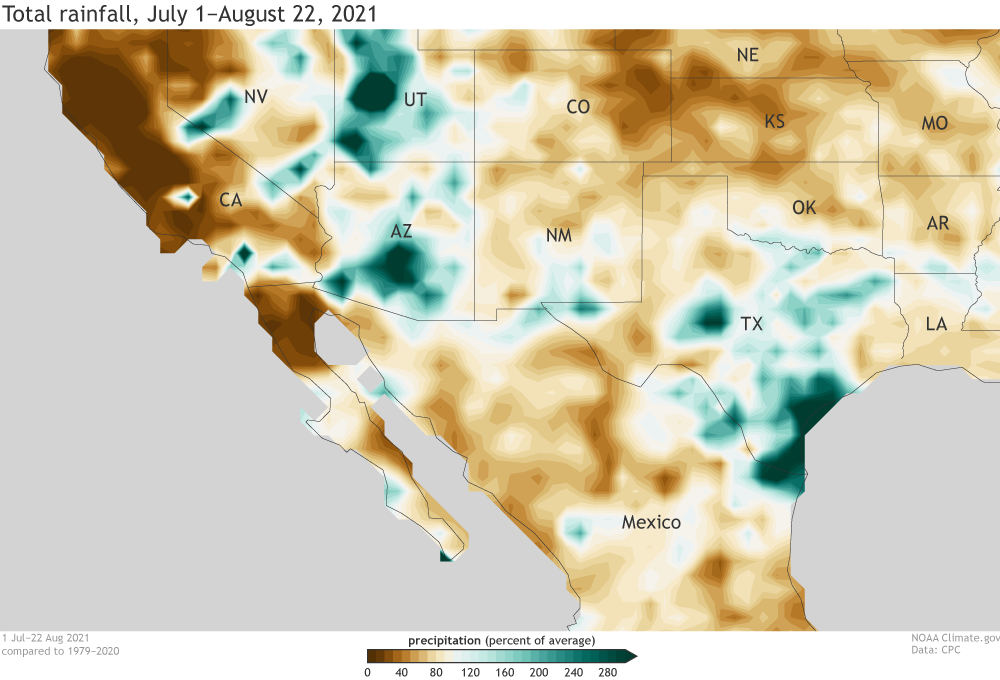
July 1–August 22, 2021 precipitation shown as a percent of the average July 1–August 22, based on 1979–2020. Brown indicates where precipitation has been less than average; green is greater than average. Figure by climate.gov; data from CPC Unified data.