
Image caption
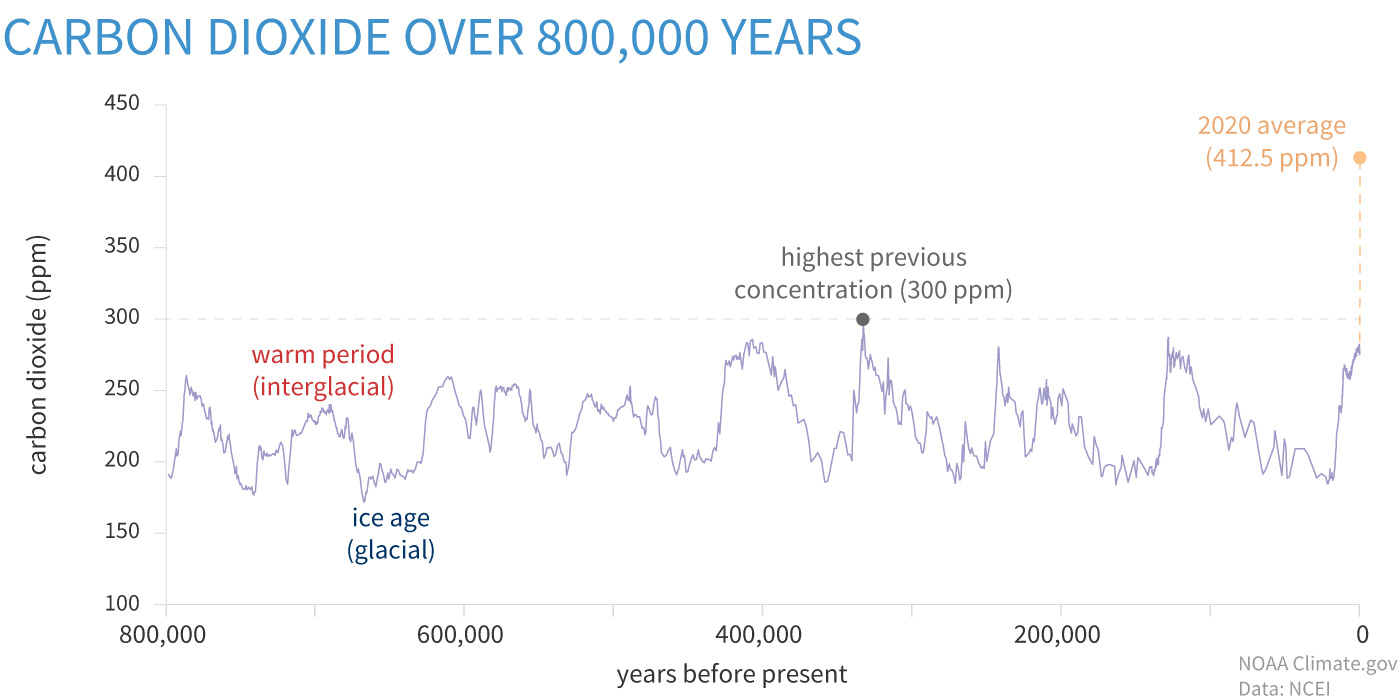
Atmospheric carbon dioxide concentrations (CO2) in parts per million (ppm) for the past 800,000 years. On the geologic time scale, the increase to today’s levels (orange dashed line) looks virtually instantaneous. Graph by NOAA Climate.gov based on data from Lüthi et al., 2008, via the NOAA NCEI Paleoclimatology Program.