
Image caption
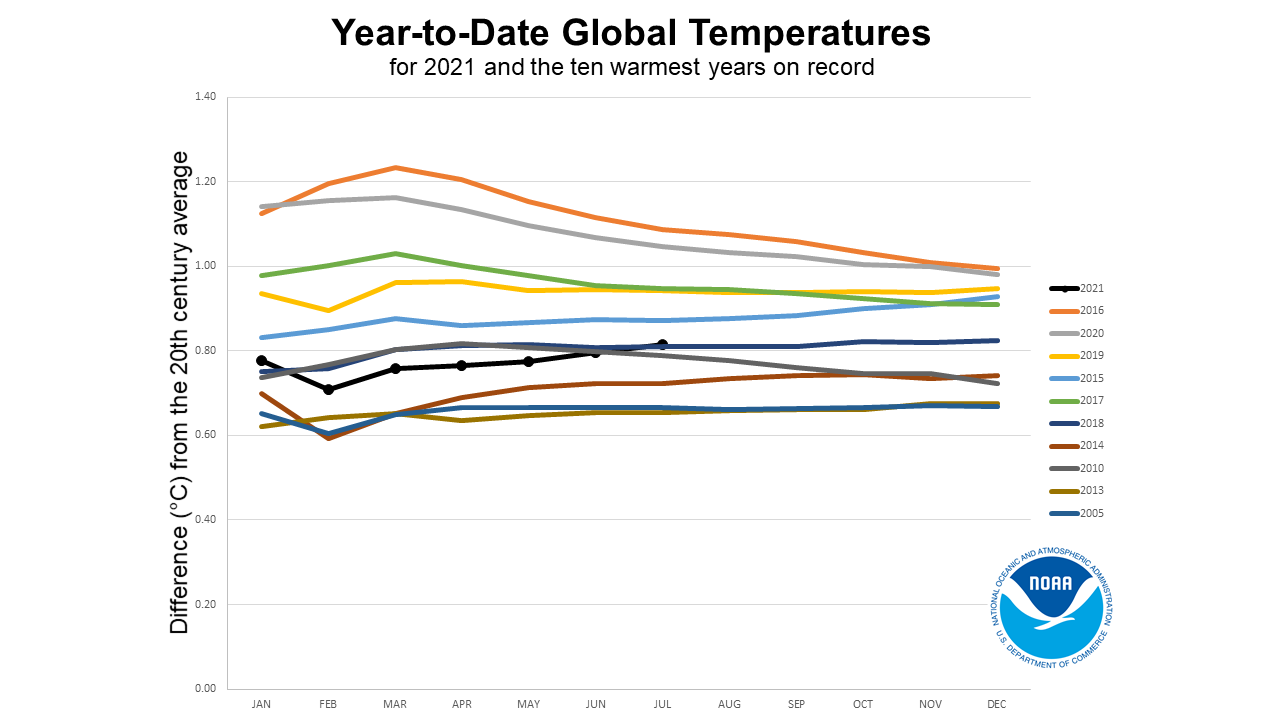
Year to date temperatures through July for 2021 (black line) plus the running year-to-date temperatures for the 10 hottest years in the historical record (colored lines). Image by NOAA NCEI.
Year to date temperatures through July for 2021 (black line) plus the running year-to-date temperatures for the 10 hottest years in the historical record (colored lines). Image by NOAA NCEI.