
Image caption
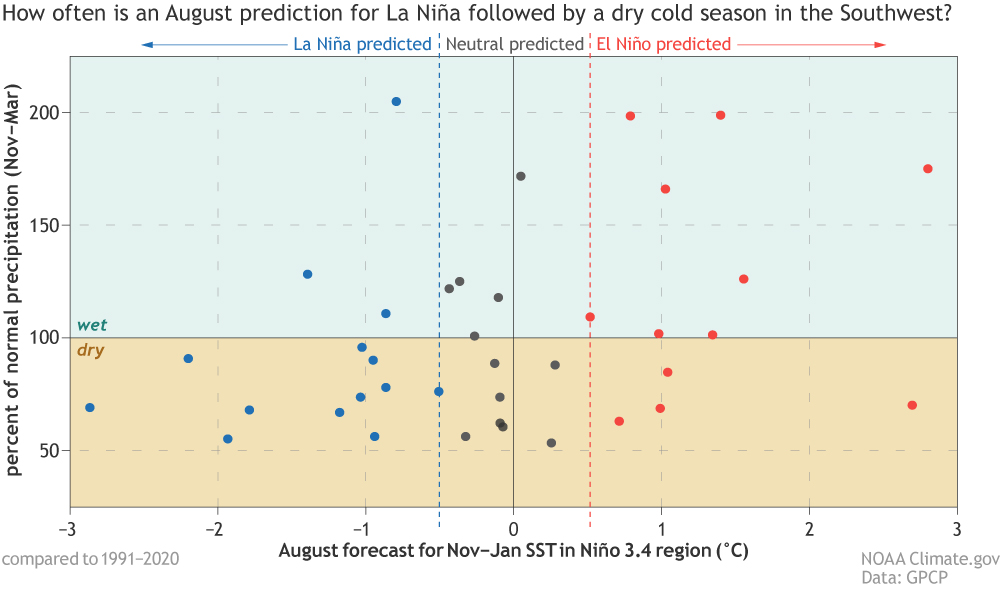
The relationship between southwestern US cold season precipitation and forecasts for early winter ENSO issued by the North American Multi-Model Ensemble (NMME) in August. The y-axis shows the percentage of accumulated cold season (November – March) precipitation relative to the 1991-2020 average. The x-axis shows the model average August forecast for the early winter (November – January) Niño 3.4 Index, with blue dots indicating forecasts of La Niña conditions (Niño 3.4 Index less than -0.5°C), black dots indicating neutral-ENSO forecasts (Niño 3.4 Index greater than -0.5°C but less than 0.5°C), and red dots indicating forecasts of El Niño conditions (Niño 3.4 Index greater than 0.5°C). The southwestern US precipitation is averaged over all land regions between 30°N and 38°N and between 102°W and 125°W. The data cover all winters from 1982-2020. Precipitation data from GPCP via ESRL PSL; image by Climate.gov.