
Image caption
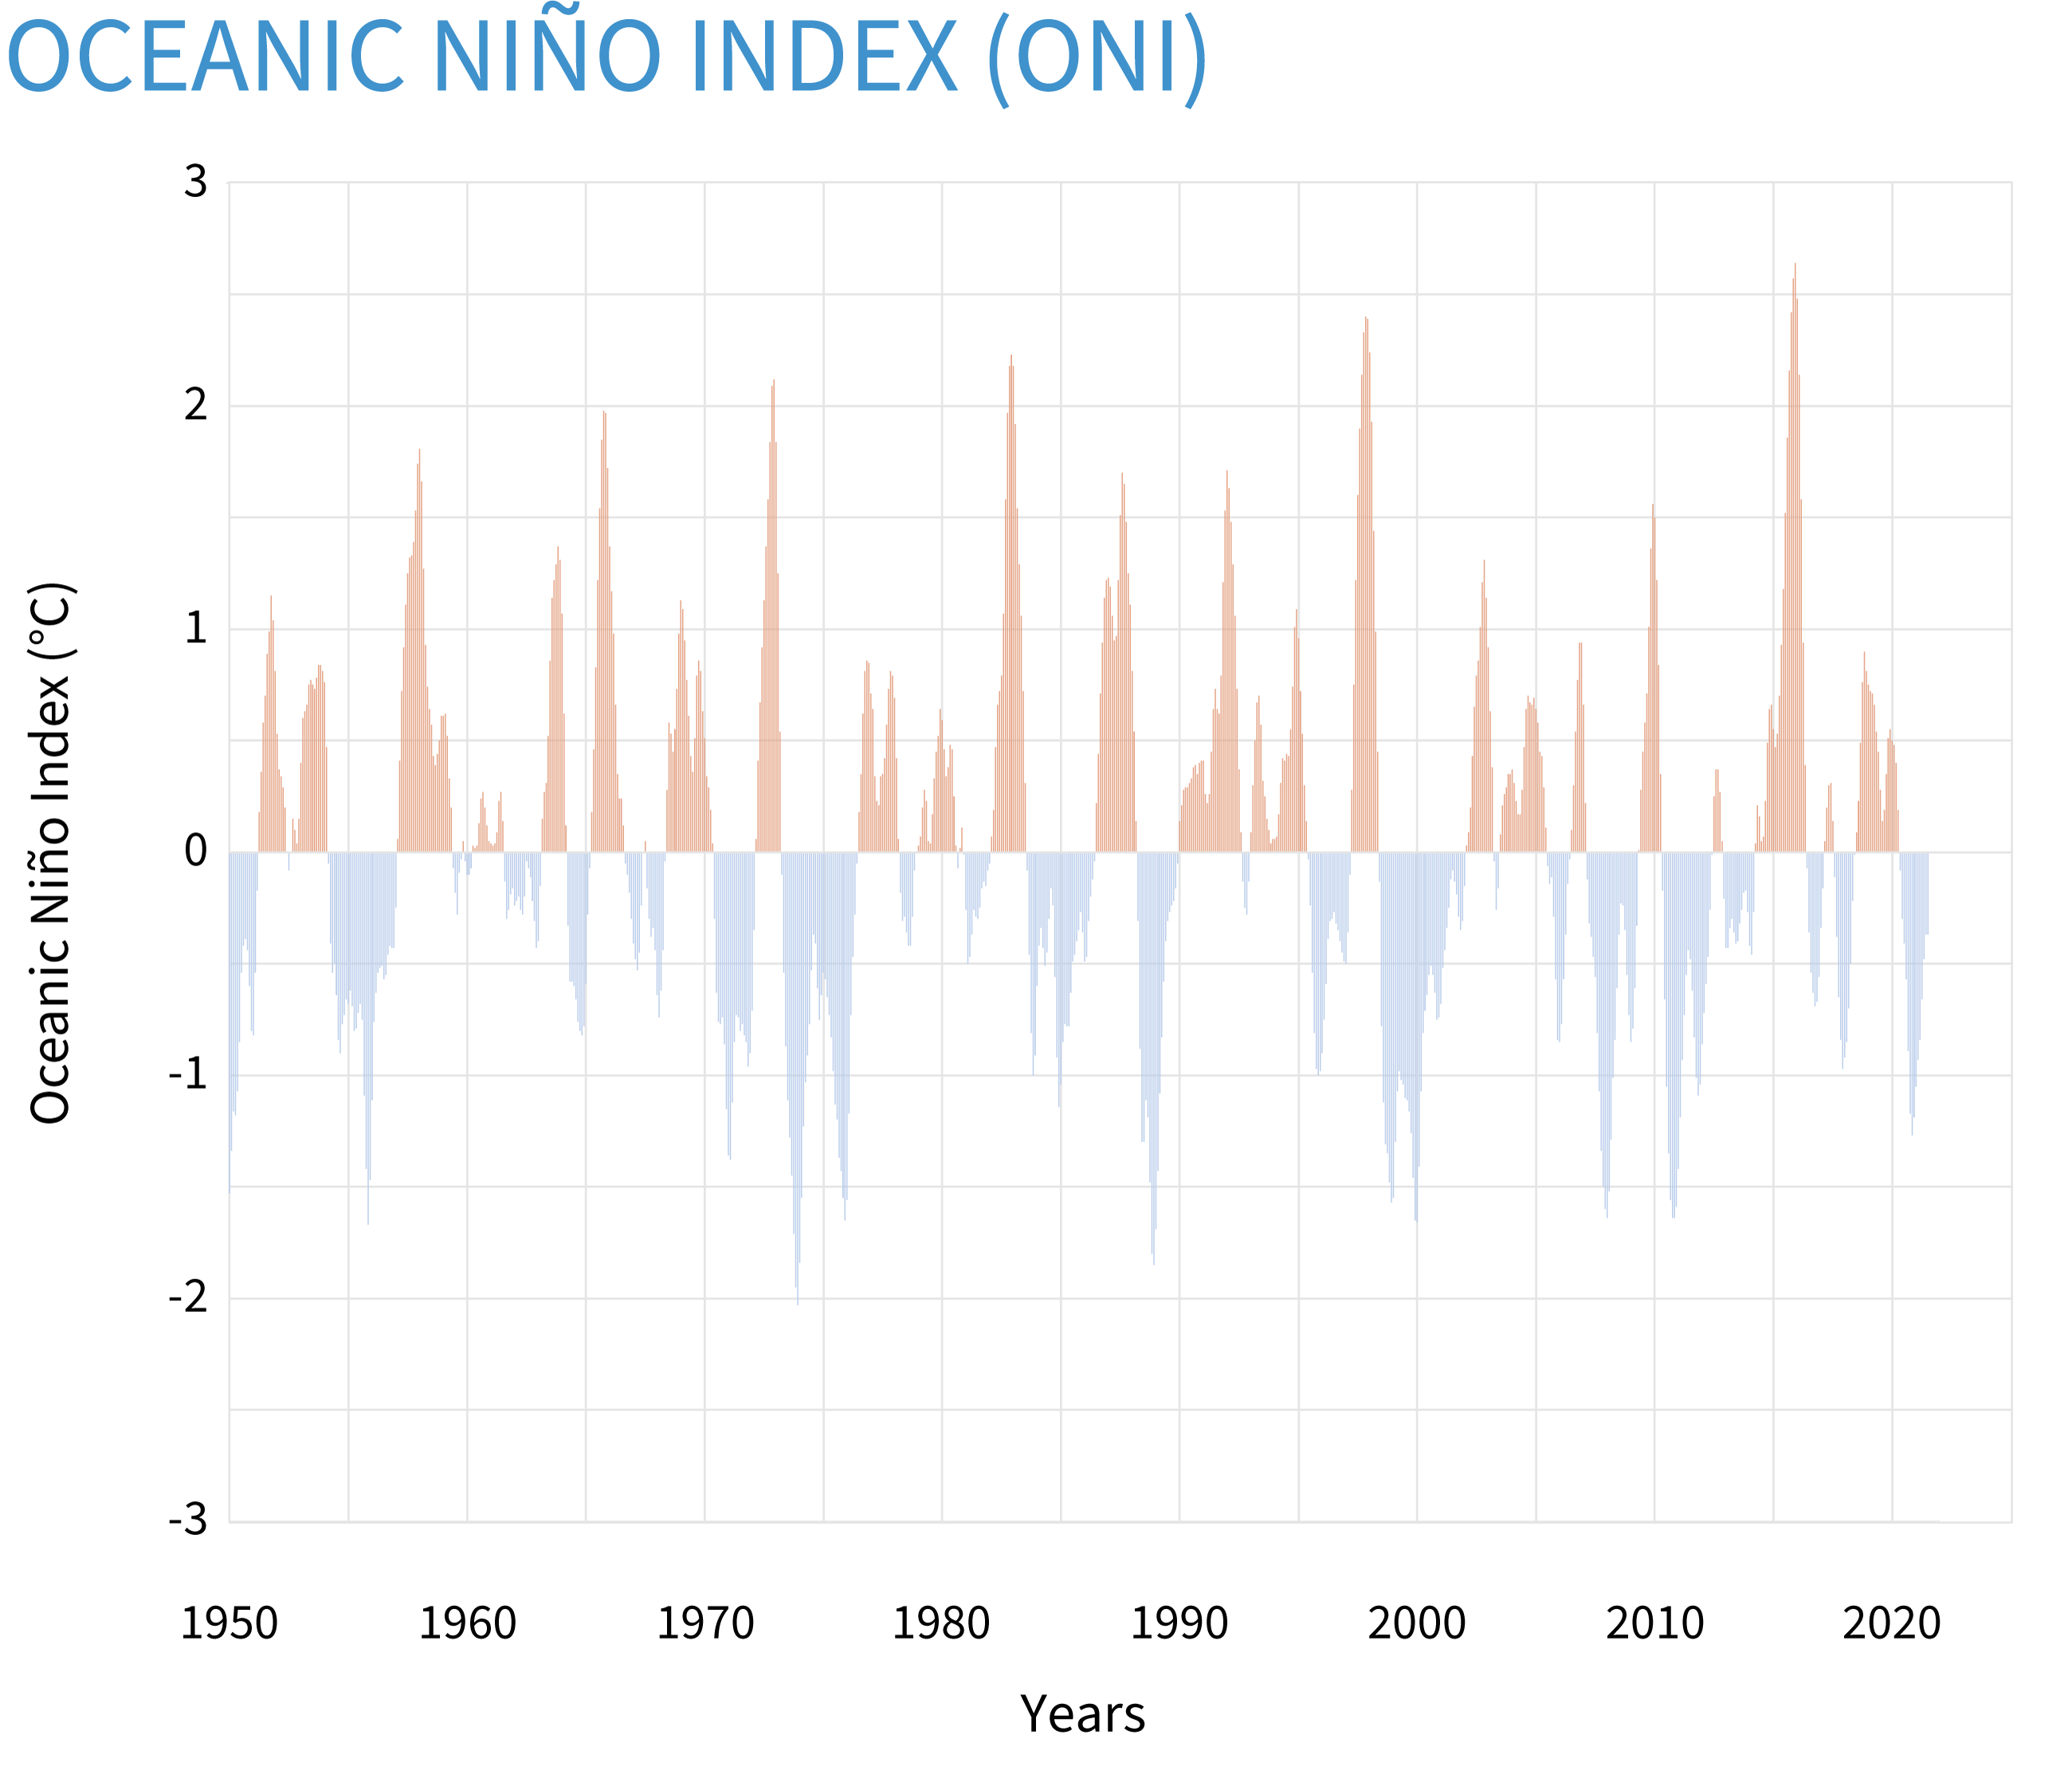
The Oceanic Niño Index, or ONI, from 1950-present. The ONI is the three-month sea surface temperature anomaly in the Niño3.4 region of the tropical Pacific Ocean. Red indicates above-average temperatures and blue indicates below-average temperatures. Climate.gov image using data from NOAA NWS Climate Prediction Center.