
Image caption
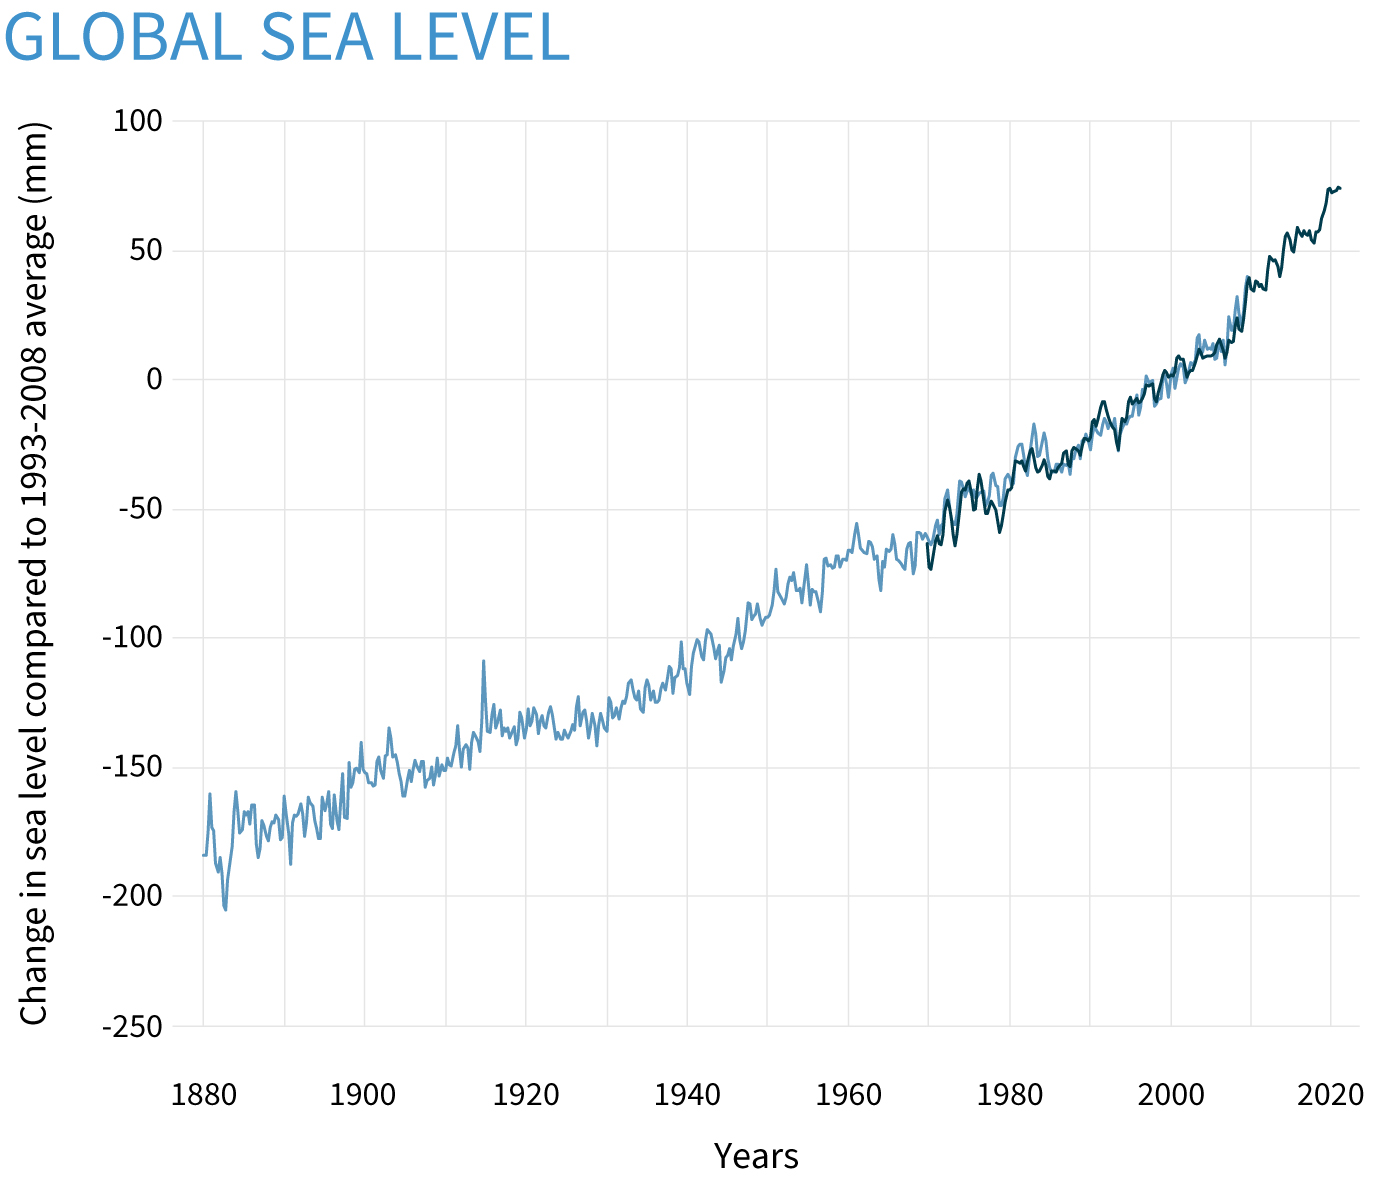
Seasonal (3-month) sea level estimates from Church and White (2011) (light blue line) and University of Hawaii Fast Delivery sea level data (dark blue). The values are shown as change in sea level in millimeters compared to the 1993-2008 average. NOAA Climate.gov image based on analysis and data from Philip Thompson, University of Hawaii Sea Level Center.