
Image caption
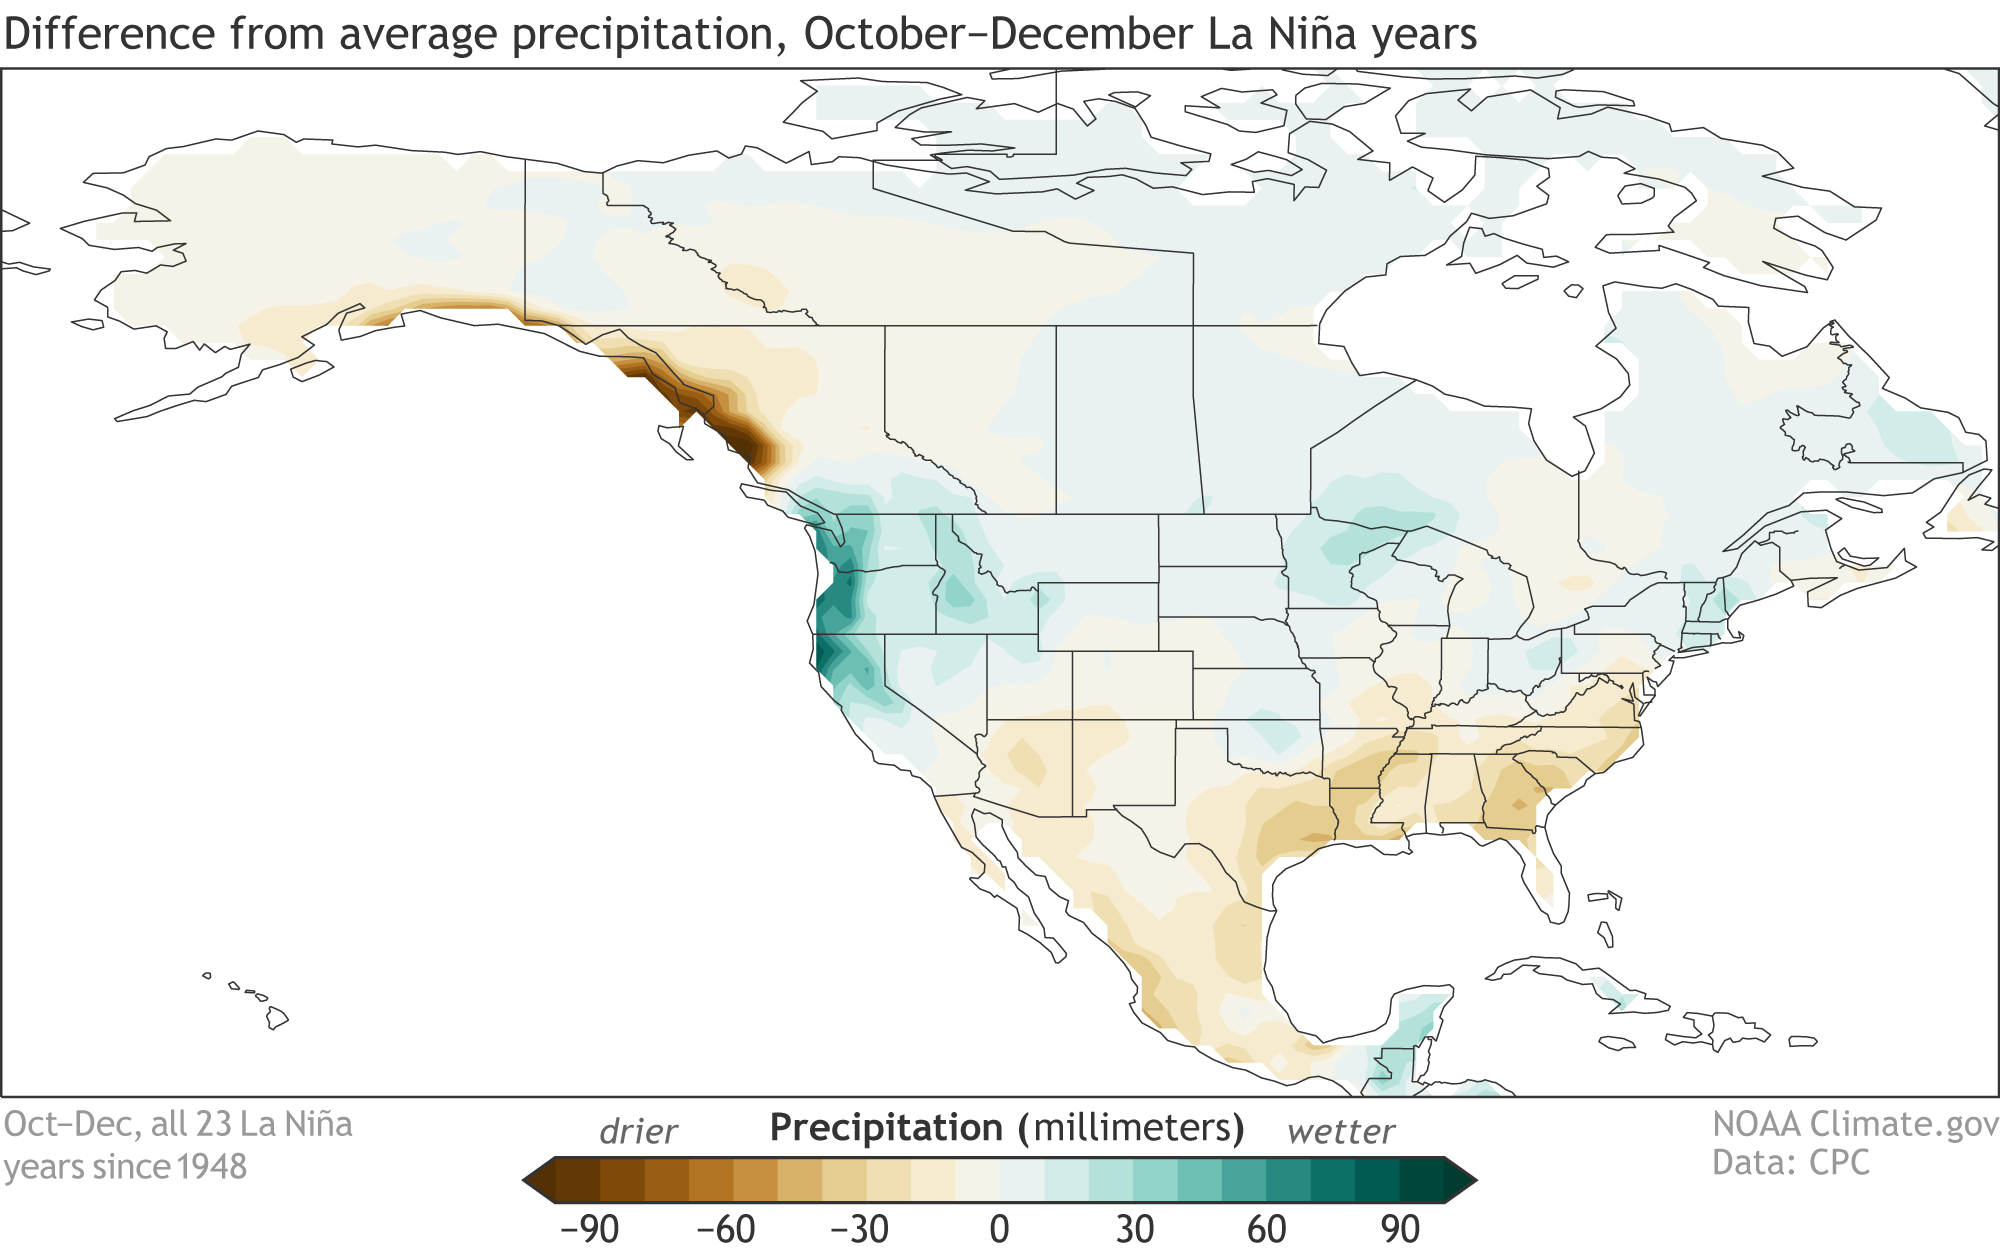
Composite of October–December precipitation during the 23 La Niña years since 1950, compared to the 1950–2020 average. Composites for other seasons and temperature are available here. Climate.gov image from CPC data.
Composite of October–December precipitation during the 23 La Niña years since 1950, compared to the 1950–2020 average. Composites for other seasons and temperature are available here. Climate.gov image from CPC data.