
Image caption
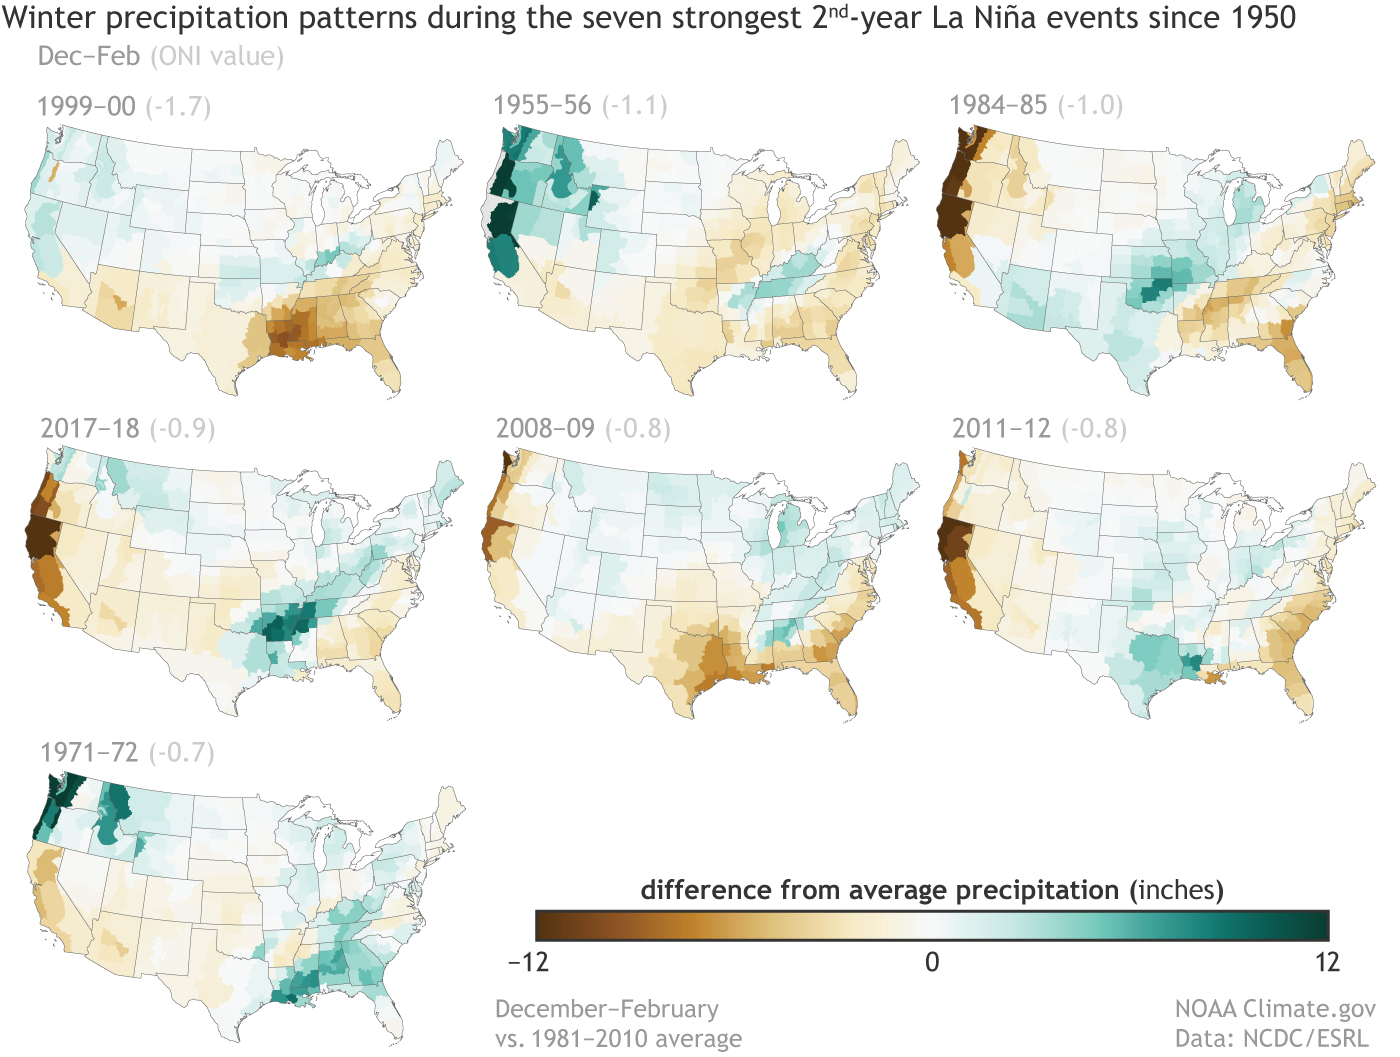
Winter precipitation patterns during each of the 7 La Niña episodes since 1950 that were (1) among the 20 strongest La Niña episodes since 1950, and (2) the second winter of a double-dip La Niña, as in the upcoming winter. As in the first figure above, dark green colors indicate much wetter-than-normal conditions, and dark brown colors indicate much drier-than-normal conditions. Maps by NOAA Climate.gov, based on NCEI climate division data provided by the Physical Sciences Division at NOAA ESRL.