
Image caption
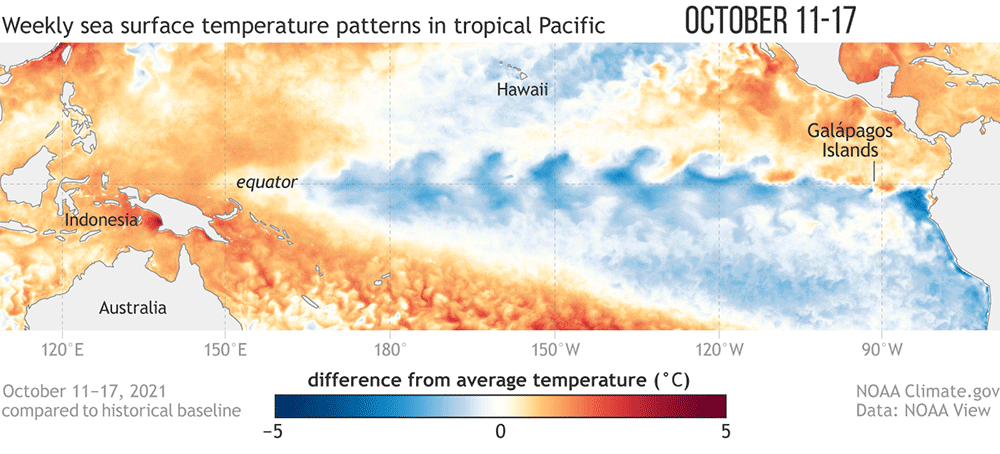
Sea surface temperature difference from the long-term average from mid-October 2021 to early December. Graphic by Climate.gov, based on data from NOAA’s Environmental Visualization Lab. Description of historical baseline period here.
This website is an ARCHIVED version of NOAA Climate.gov as of June 25, 2025.
Content is not being updated or maintained, and some links may no longer work.
Sea surface temperature difference from the long-term average from mid-October 2021 to early December. Graphic by Climate.gov, based on data from NOAA’s Environmental Visualization Lab. Description of historical baseline period here.