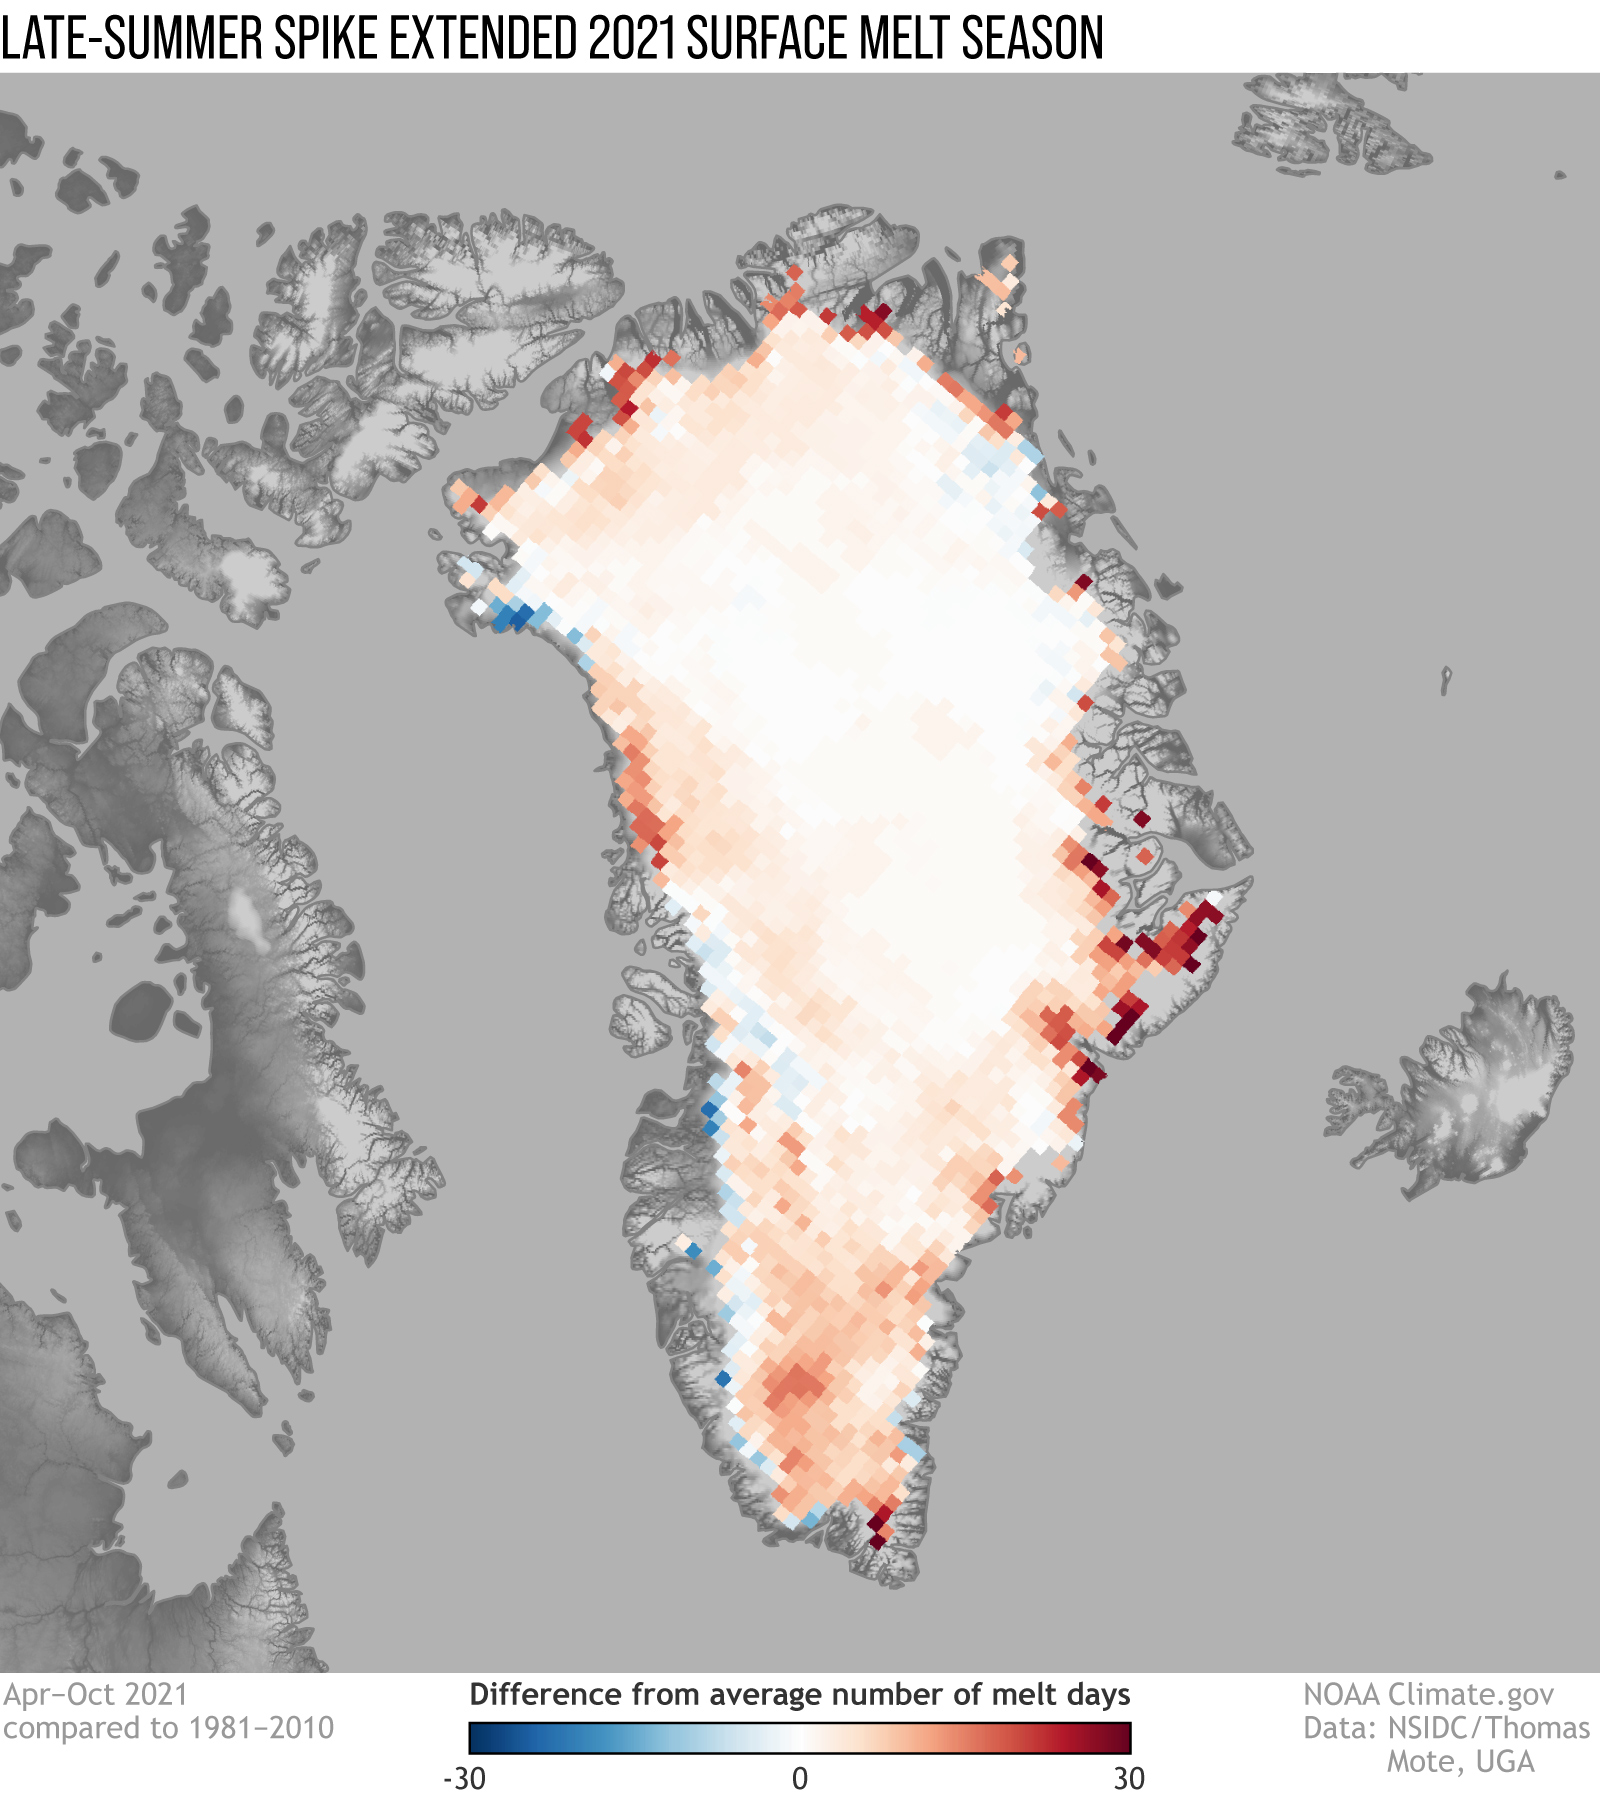
Image caption
Map of Greenland showing where the number of days on which satellites observed surface melting from April–October was above (red) or below (blue) the 1981-2010 average. The number of melt days was above average almost everywhere, including deep in the high-elevation interior of the ice sheet.