
Image caption
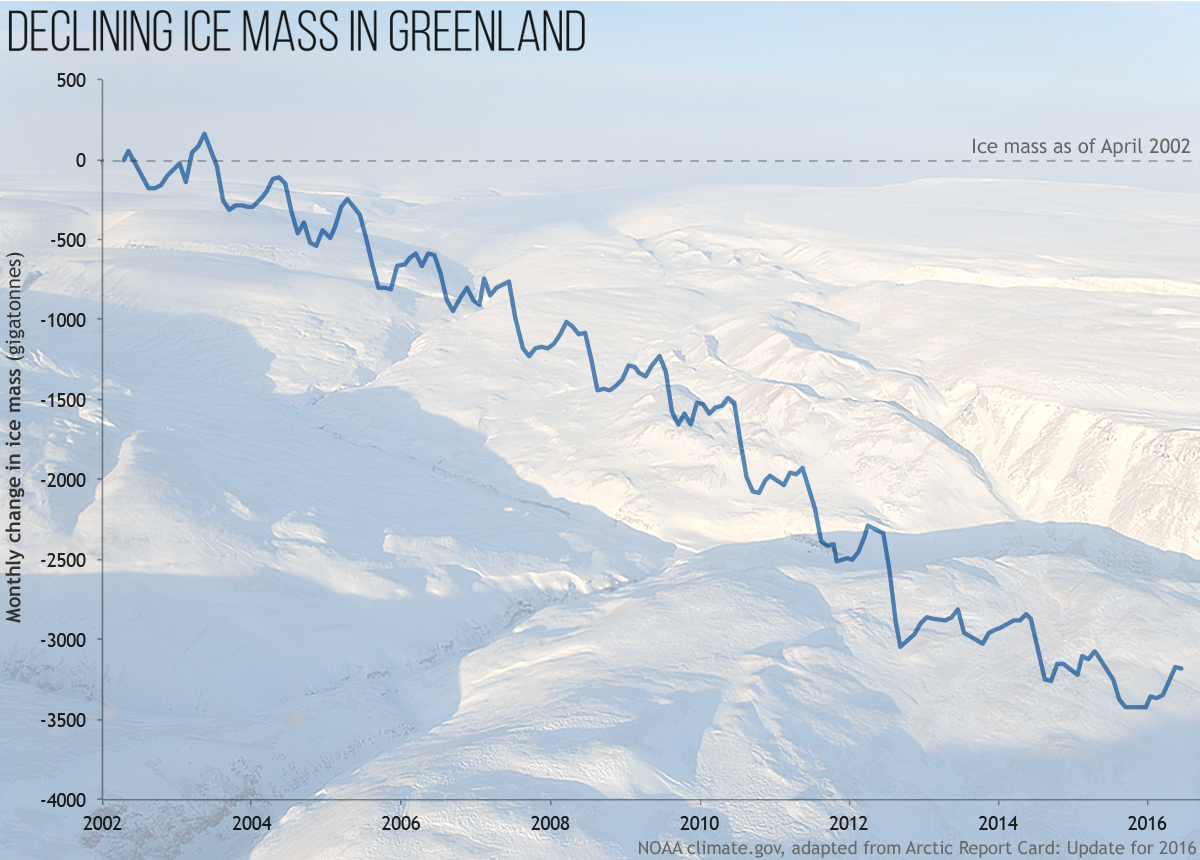
Monthly change in the total mass (in gigatonnes) of the Greenland Ice Sheet between April 2002 and April 2016, based on GRACE satellite data. The ice sheet lost an average of 268 gigatonnes per year from 2002 to 2016. NOAA Climate.gov graph adapted from Figure 3.4 in the 2016 Arctic Report Card. Background photo from NASA P3-Orion aircraft.