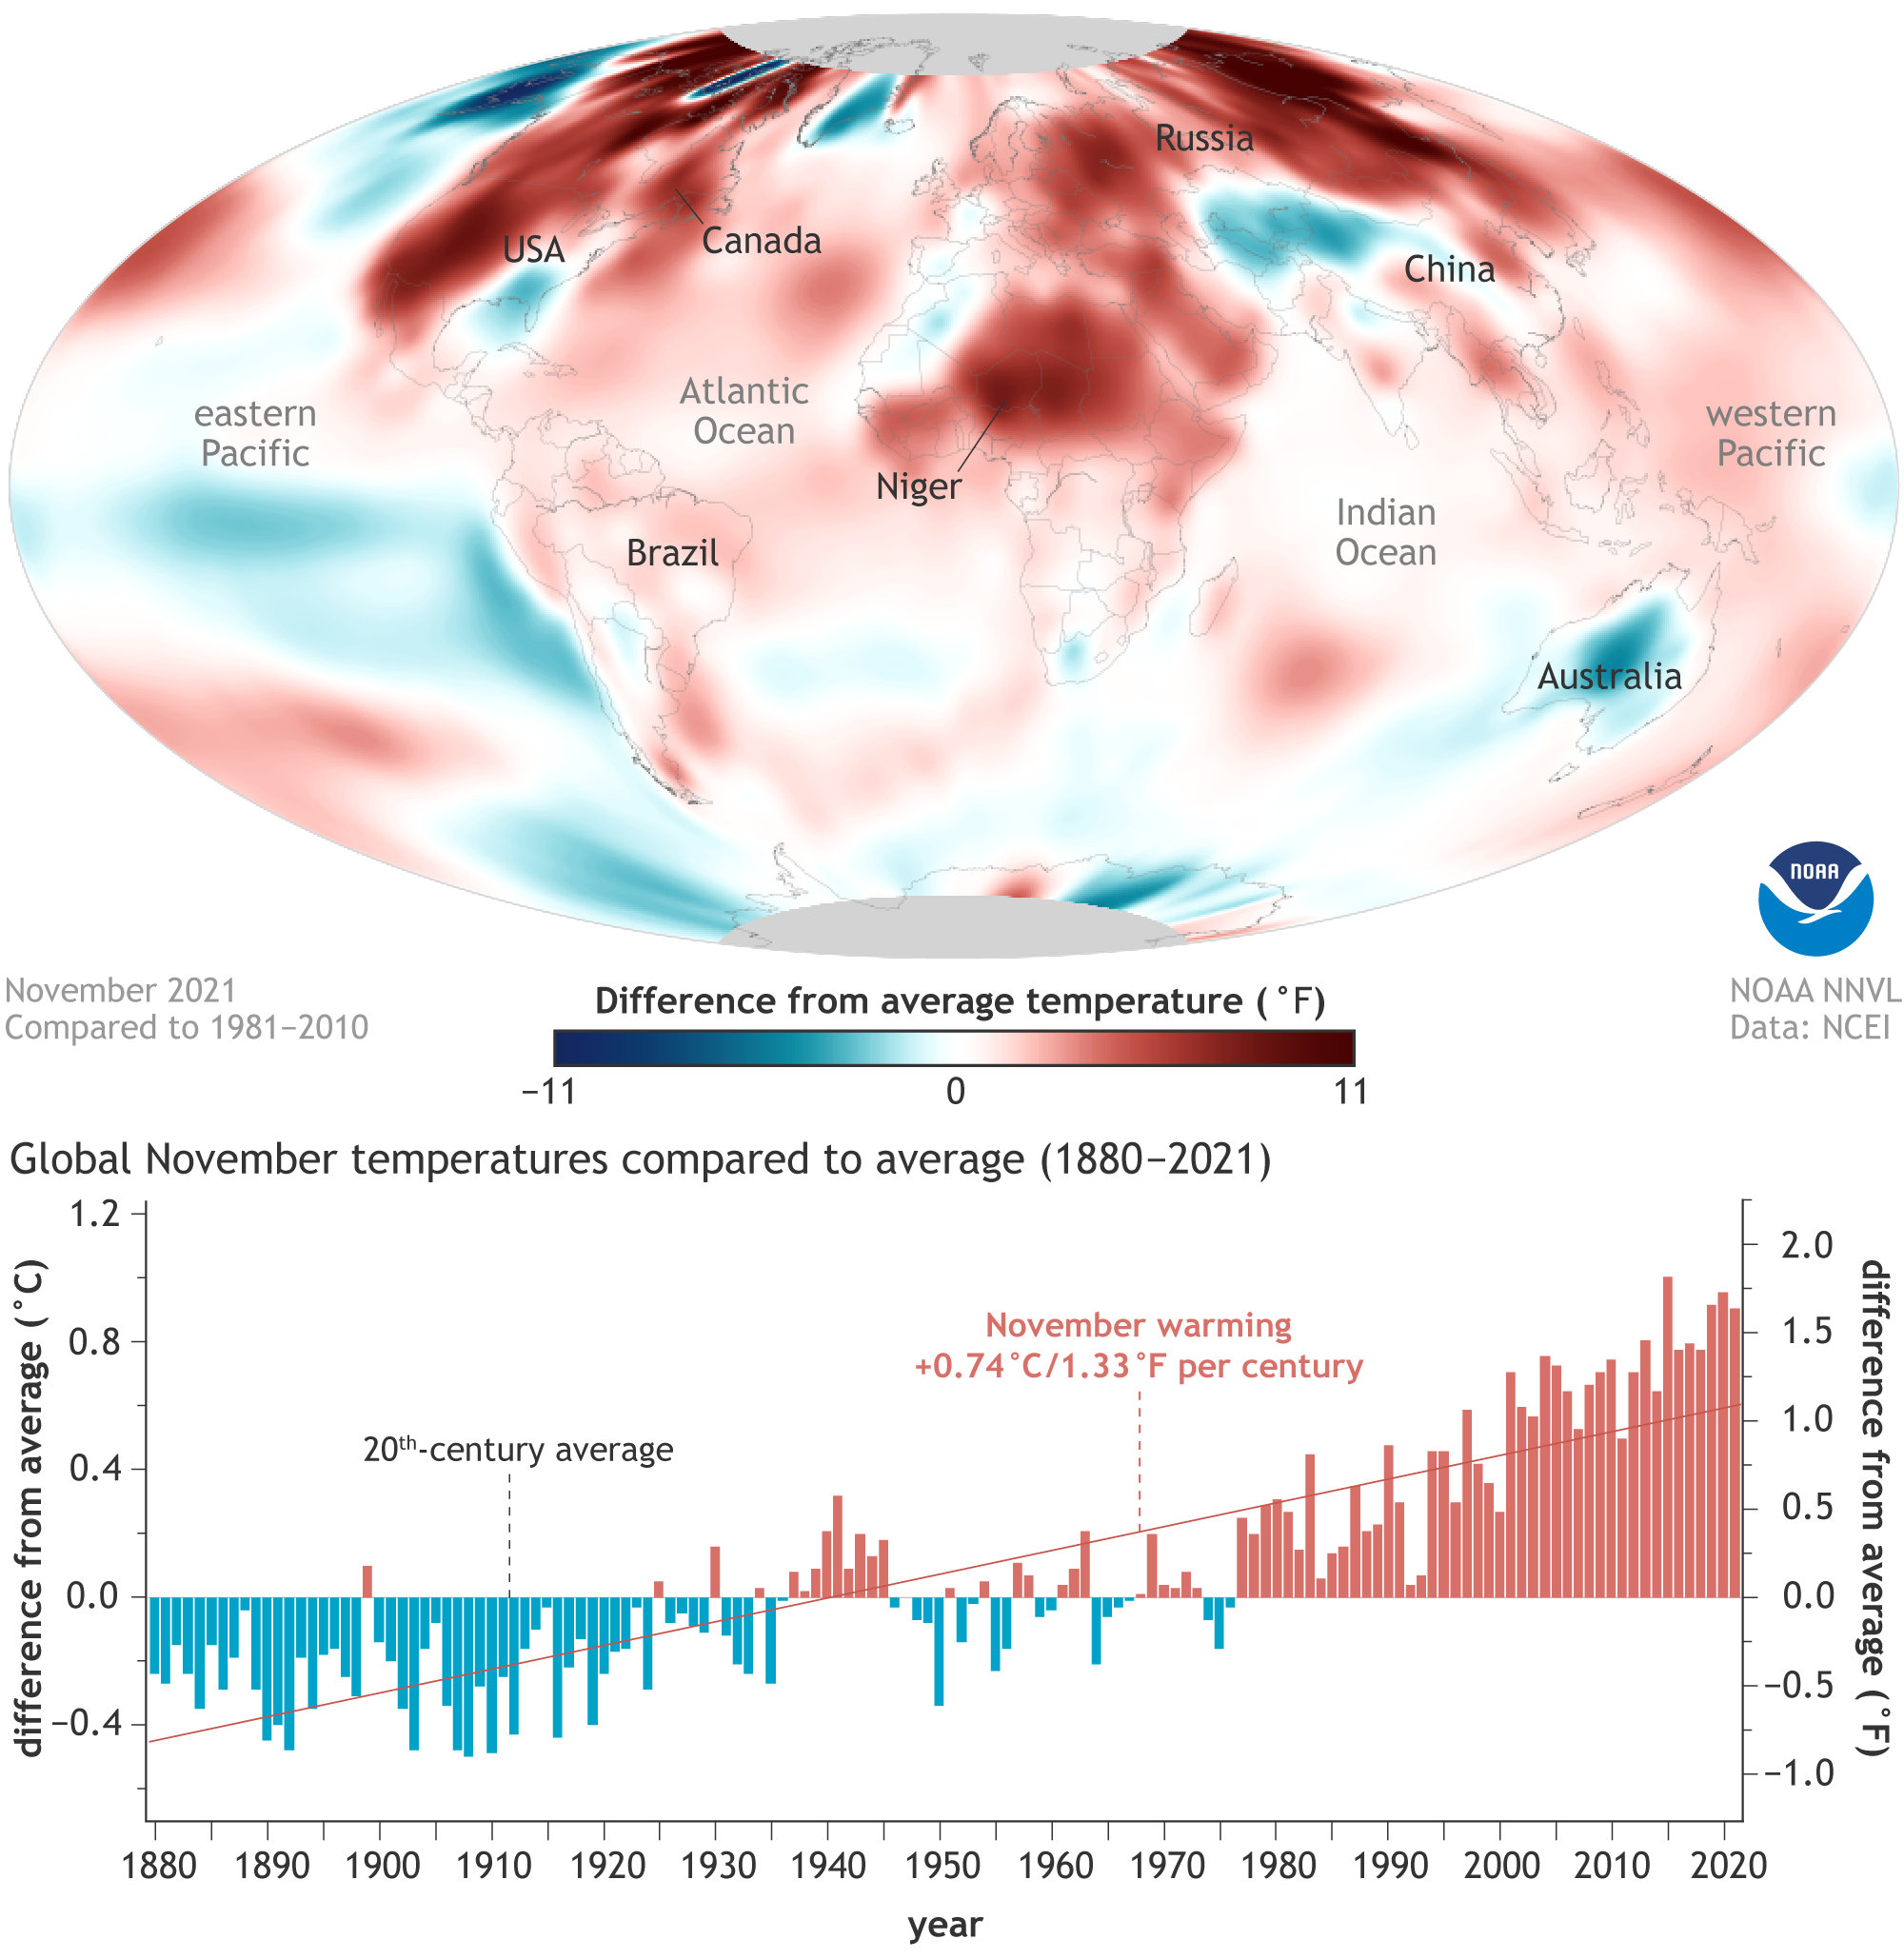
Image caption
(map) Temperatures across the globe in November 2021 compared to the 1981–2010 average. Northern Hemisphere land areas were especially warm, with temperatures 11 or more degrees Fahrenheit above average in places (darkest reds). In contrast, Australia and western China were cooler than average (blue). (graph) November temperatures compared to the 20th-century average each year from 1880 to 2021. There hasn't been a cooler-than-average November (blue bars) since the mid-1970s. NOAA Climate.gov image, based on data from NOAA NCEI.