
Image caption
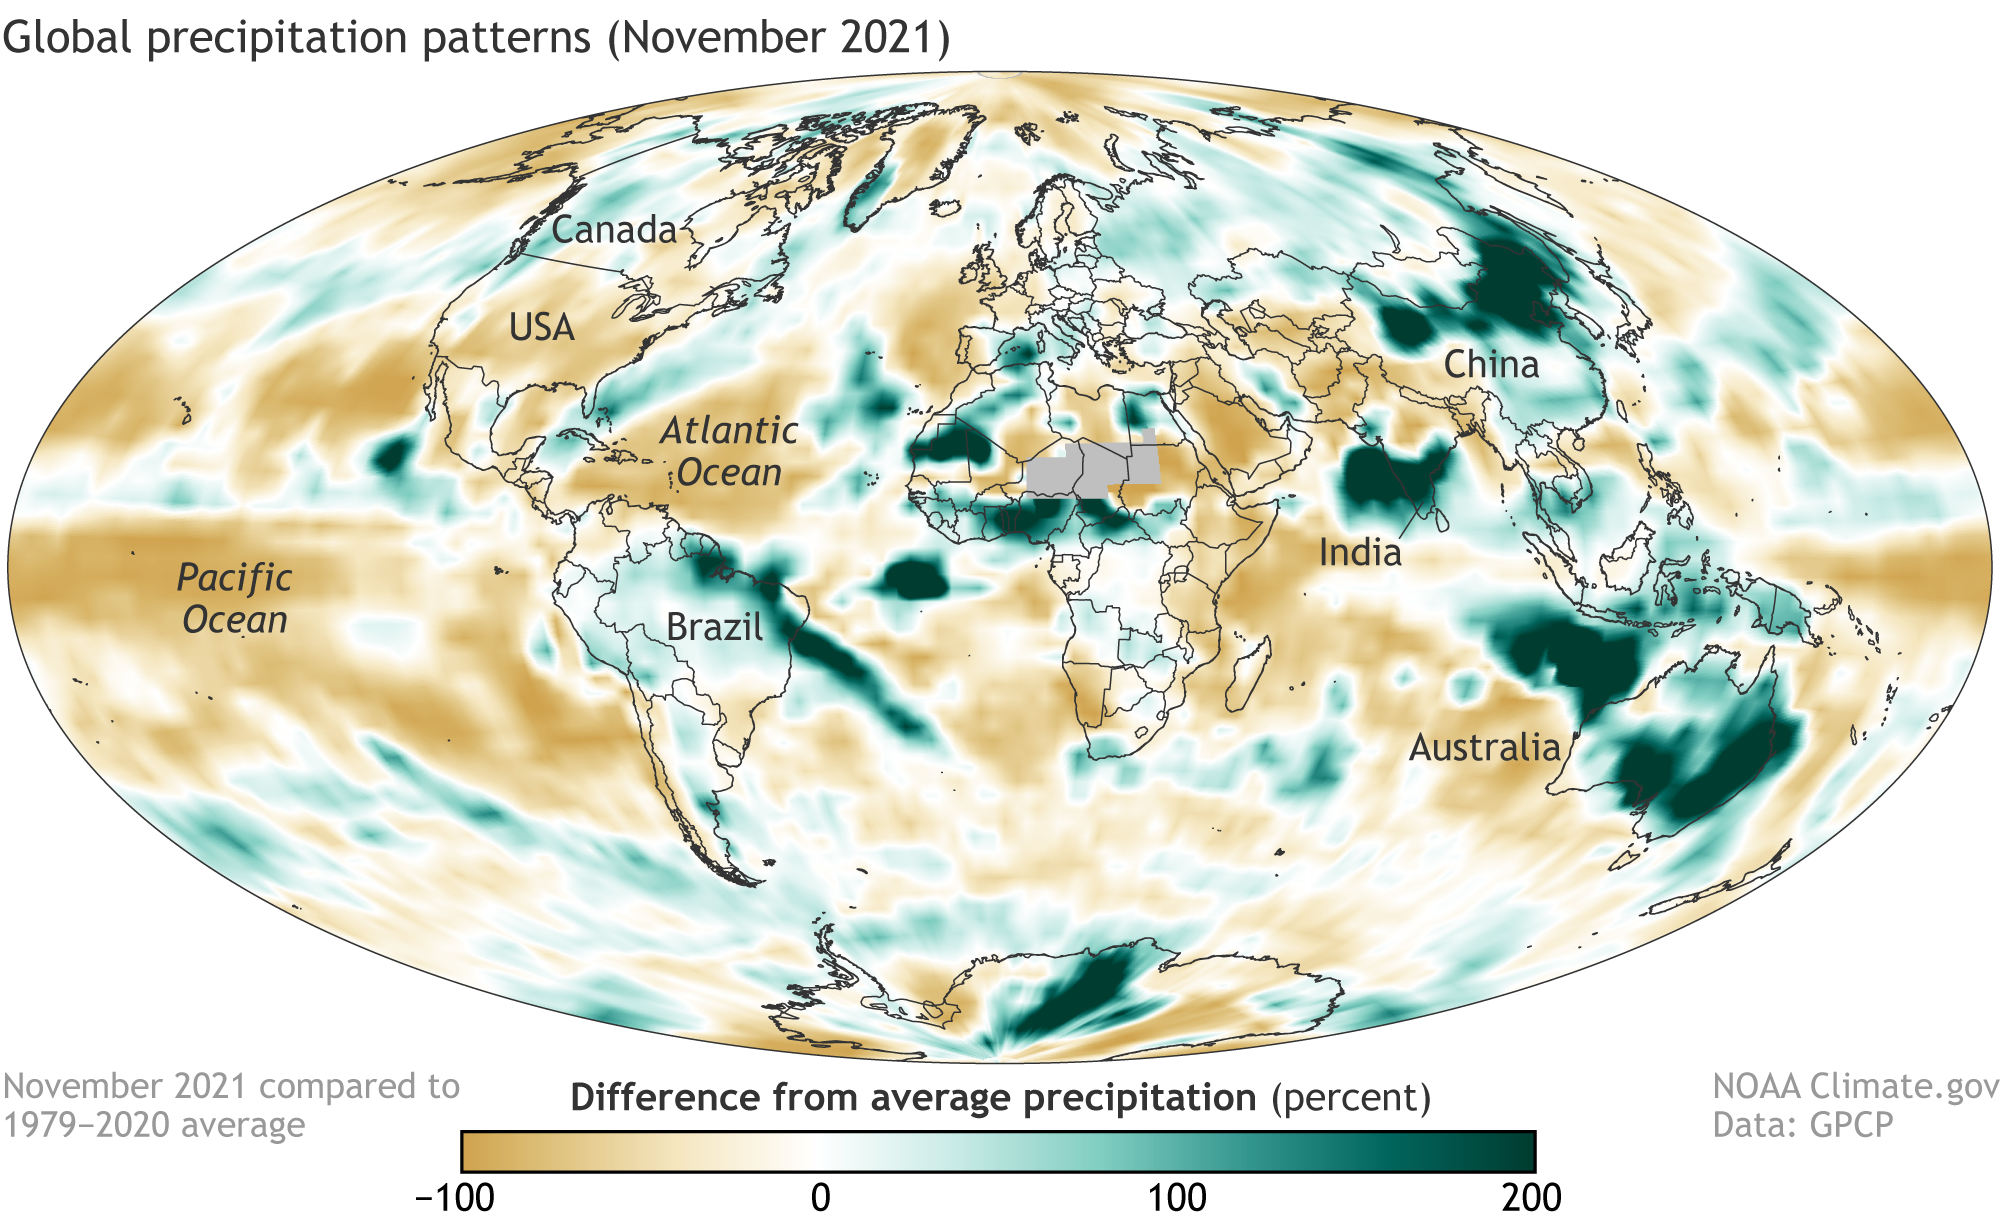
Percent difference from average precipitation in November 2021. Places where precipitation was up to 200 percent above average are green; places where precipitation was as much as 100 percent below average are brown. Map by NOAA Climate.gov, based on data from the Global Precipitation Climatology Project.