
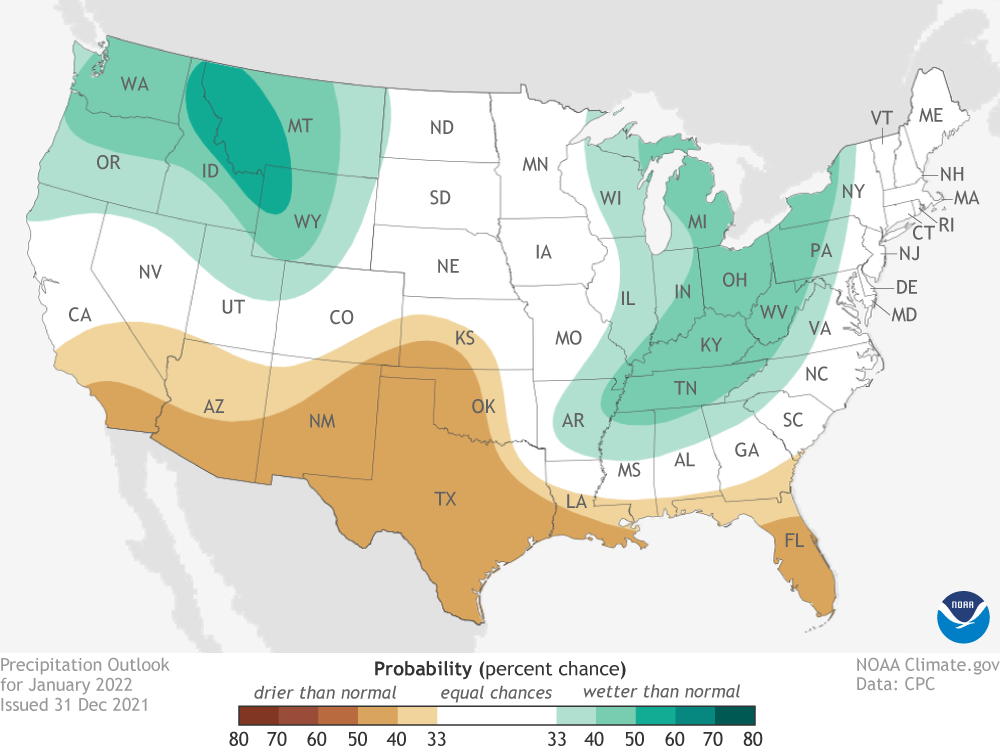
Image caption
Map of the contiguous United States (view Alaska) showing which of three precipitation outcomes—much wetter than average (greens), average, or much drier than average (browns)—is most likely for the month of January. Darker colors mean greater chances, not bigger precipitation extremes. White areas are places where the odds for a relatively wet, dry, or near-average January are equally likely. NOAA Climate.gov image, based on Climate Prediction Center data.