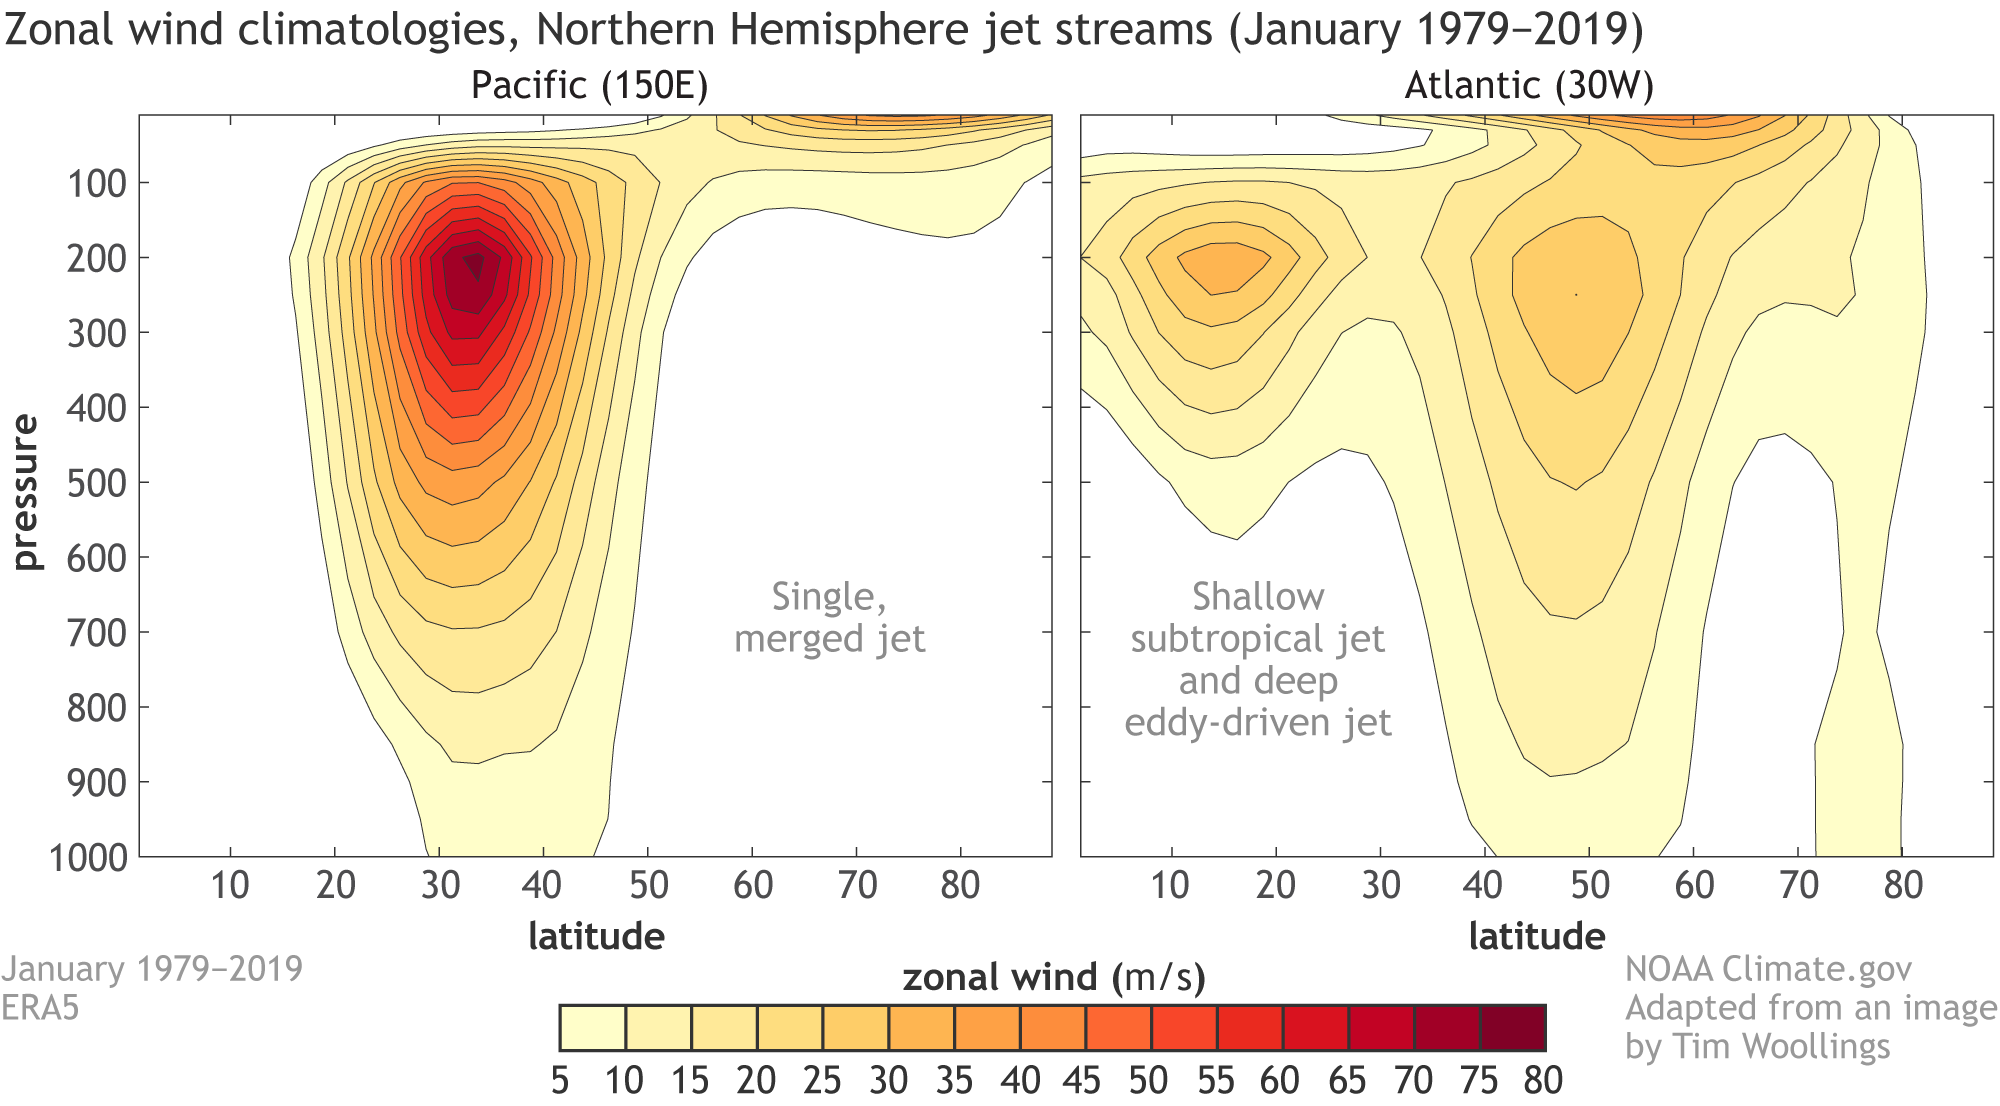
Image caption
The jet streams or average zonal wind (in meters per second) over a cross-section of the Pacific Ocean (left panel) and Atlantic Ocean (right panel). The x-axis shows the latitude in the Northern Hemisphere with the equator on the left and North Pole on the right. The y-axis is the pressure level oriented with the surface on the bottom and the top indicating the top of the atmosphere. Data is based on ERA5 using a 1979-2019 climatology. Image courtesy of Tim Woollings and modified by Climate.gov.