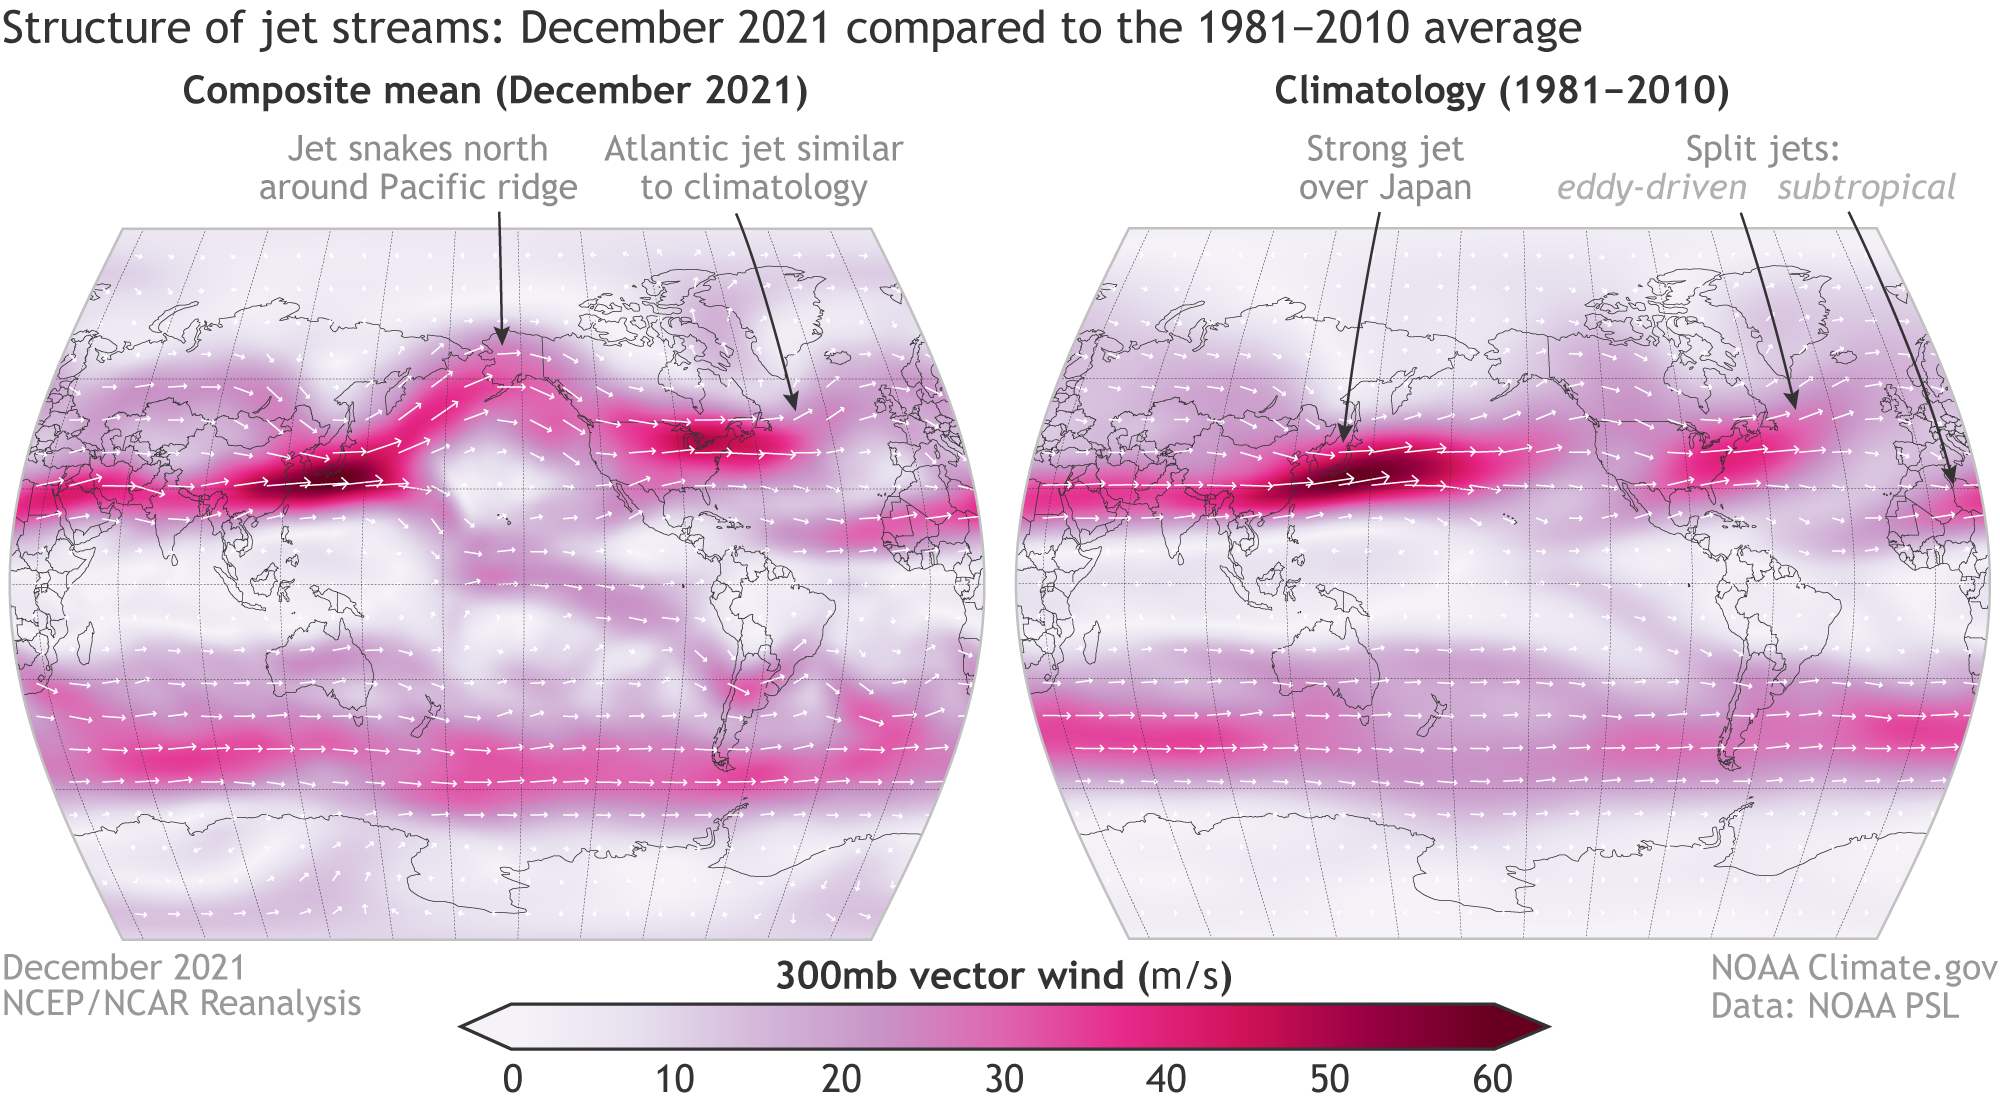
Image caption
Structure of the Northern Hemisphere jet streams in December 2021 compared to the climatology (average from 1981-2010). Display is showing the wind vectors and strength at the 300mb level in the atmosphere. Figure by NOAA Climate.gov using NOAA ESRL/PSD data.