
Image caption
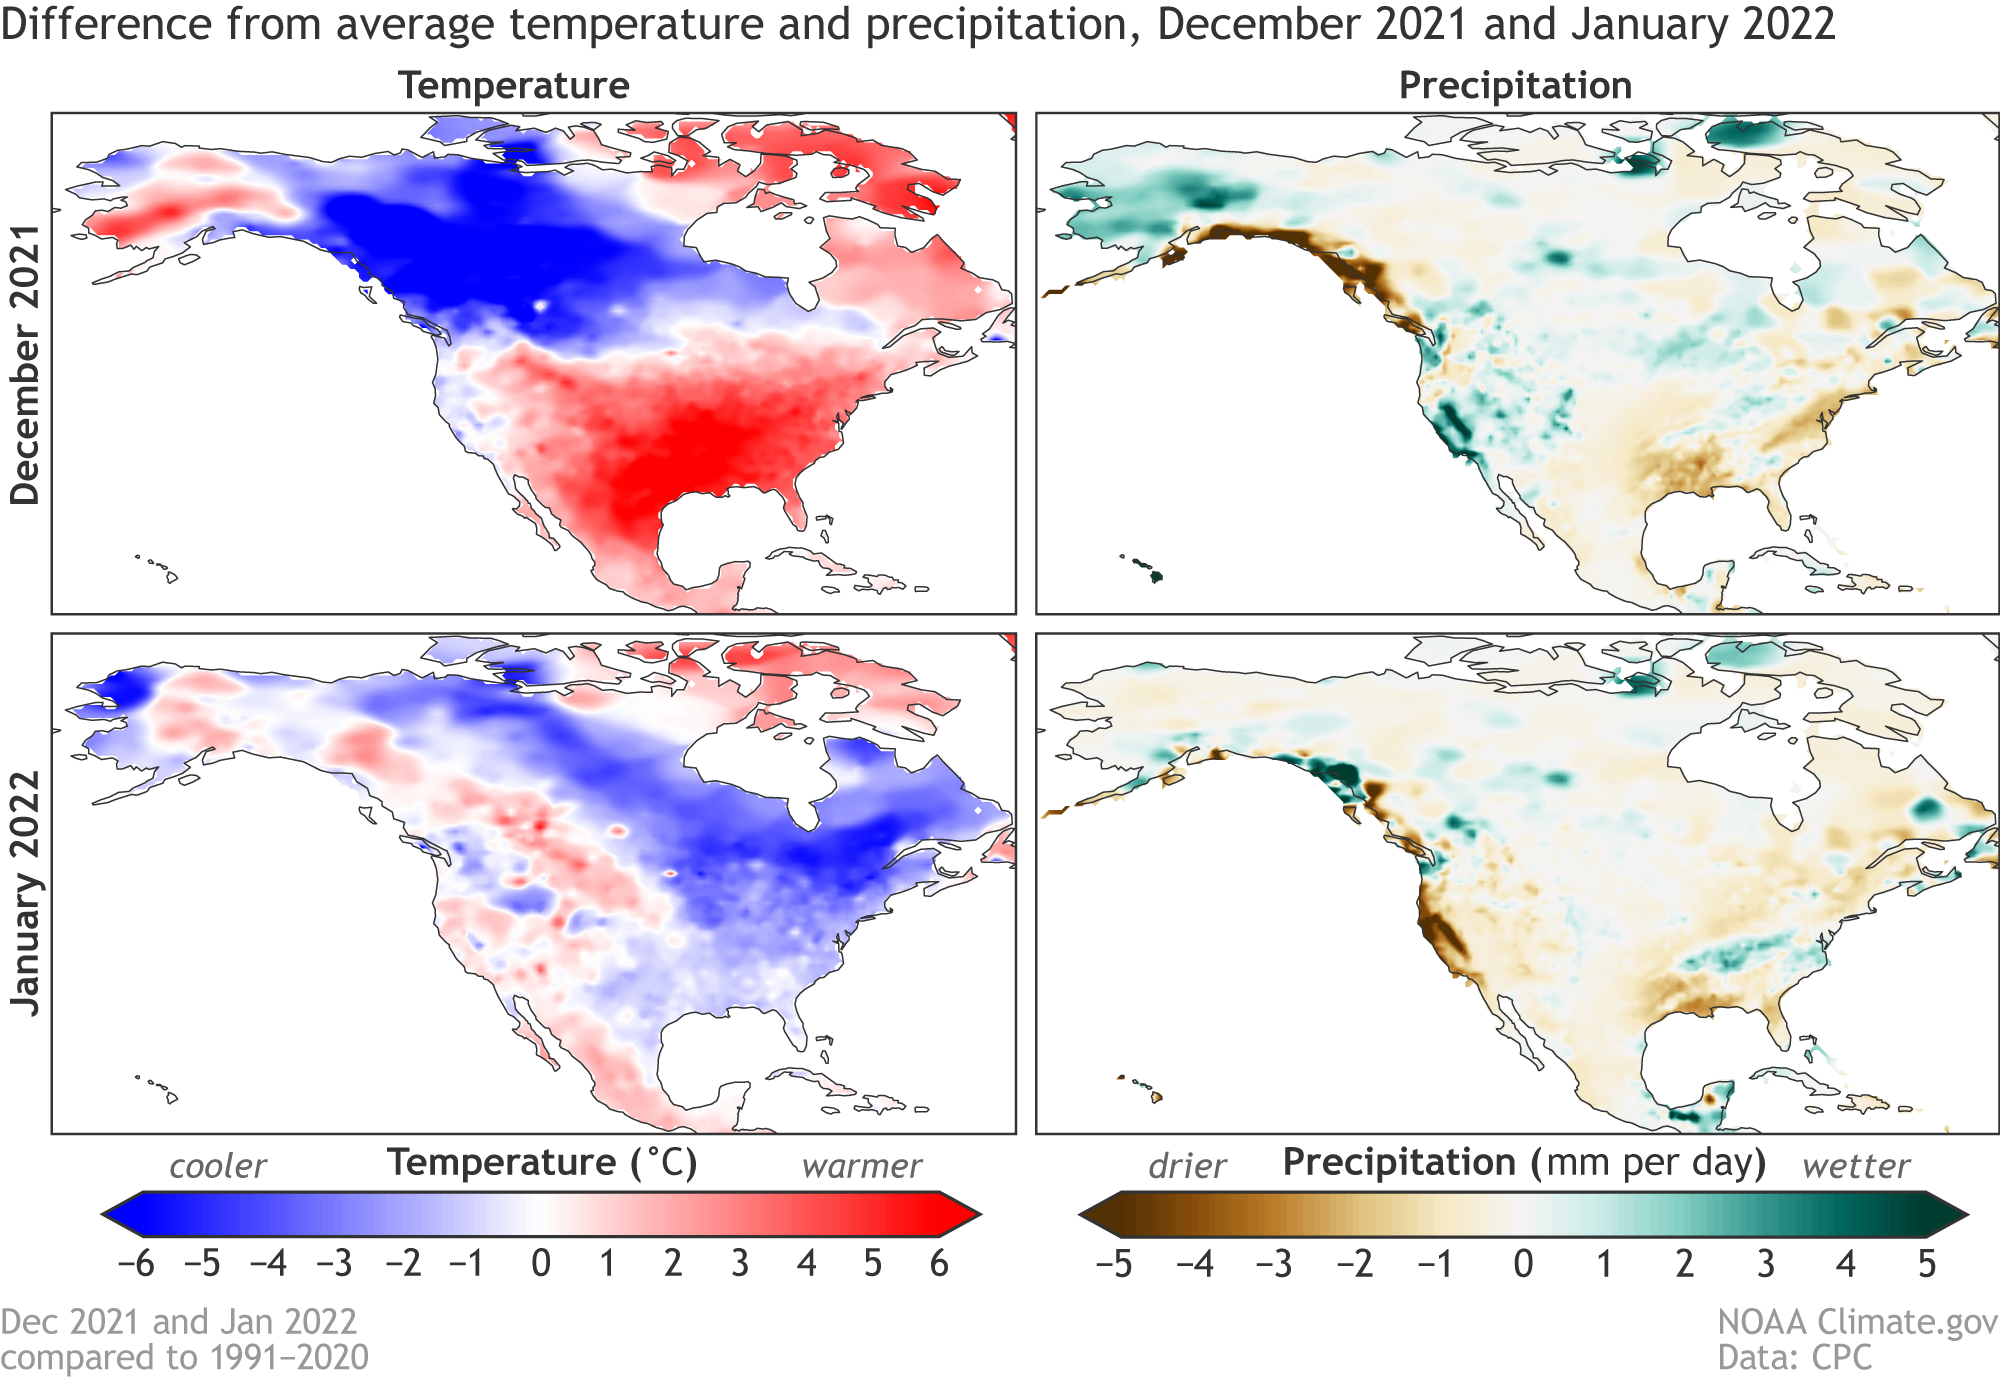
Temperature (left maps) and precipitation (right maps) difference from the 1991–2020 average during December 2021 (top row) and January 2022 (bottom row). Maps by climate.gov from CPC Global Daily Temperature data and CPC Global Daily Precipitation data.