
Image caption
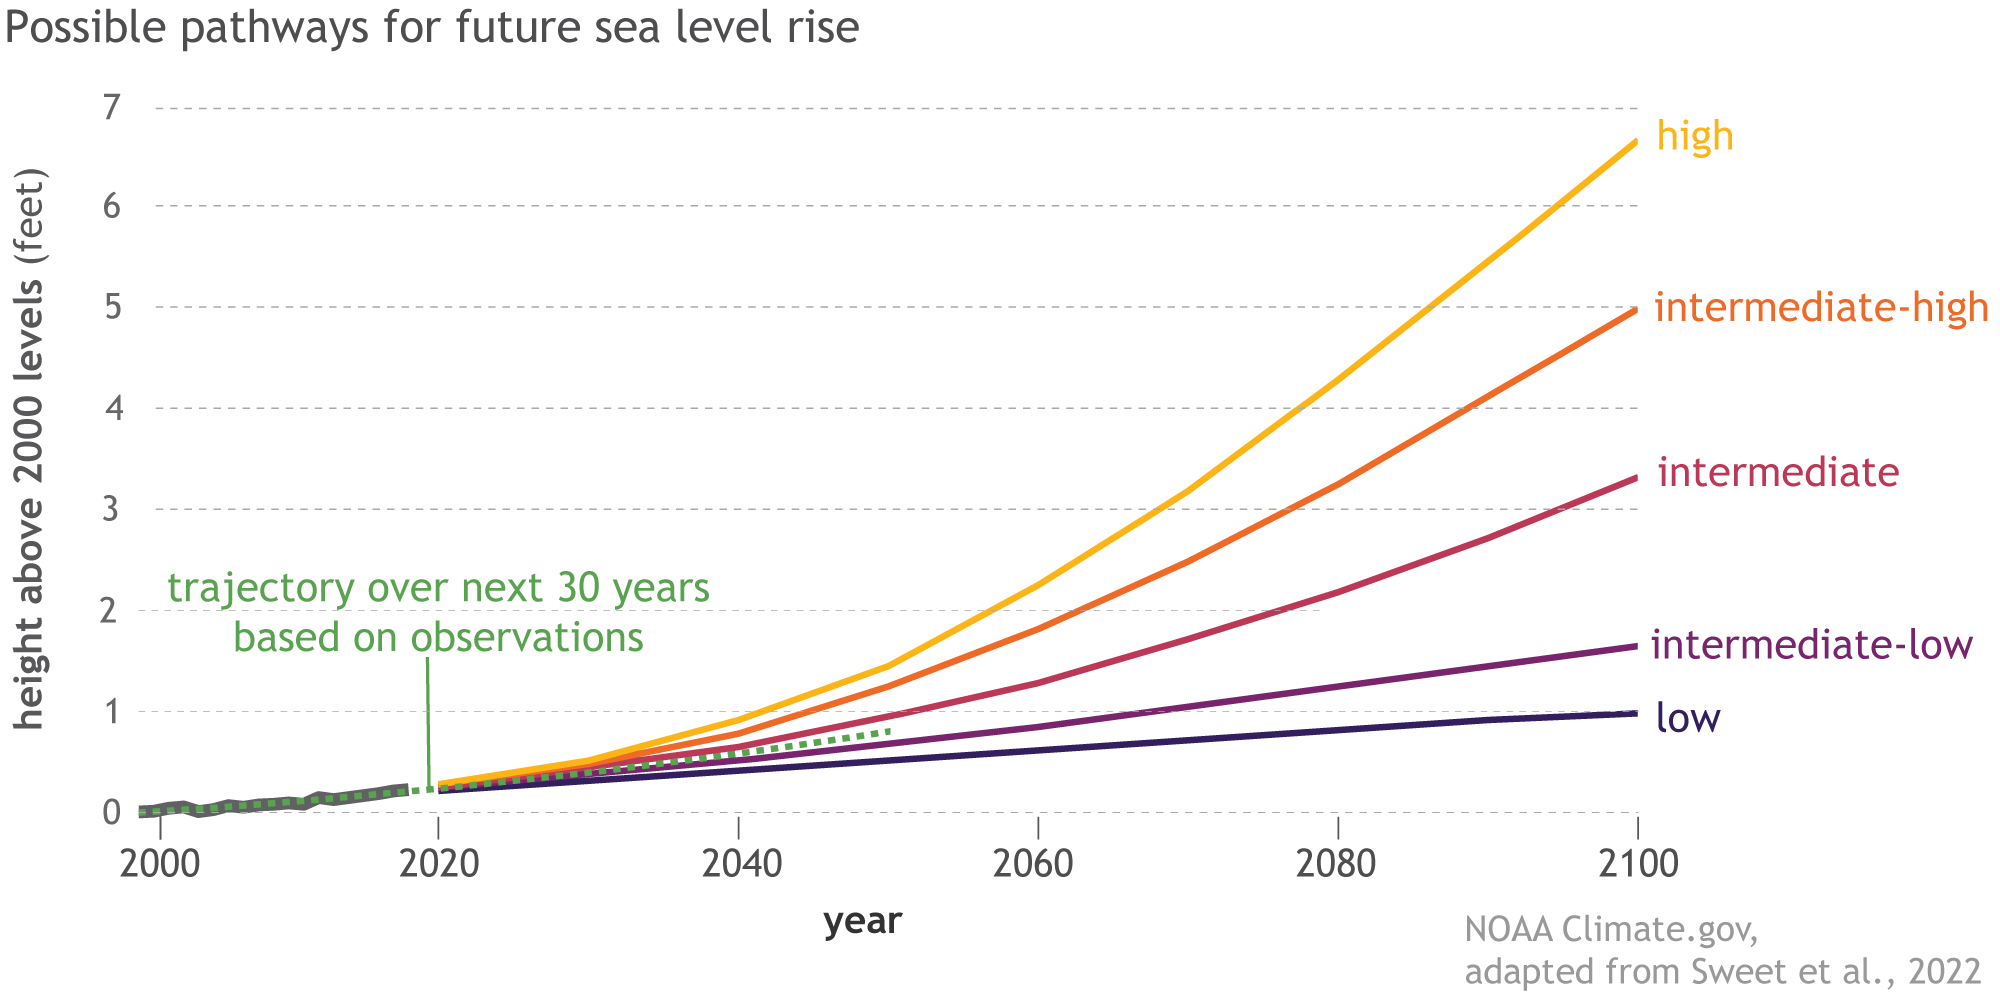
Observed sea level from 2000-2018, with future sea level through 2100 for six future pathways (colored lines) The pathways differ based on future rates of greenhouse gas emissions and global warming and differences in the plausible rates of glacier and ice sheet loss. NOAA Climate.gov graph, adapted from Sweet et al., 2022.