
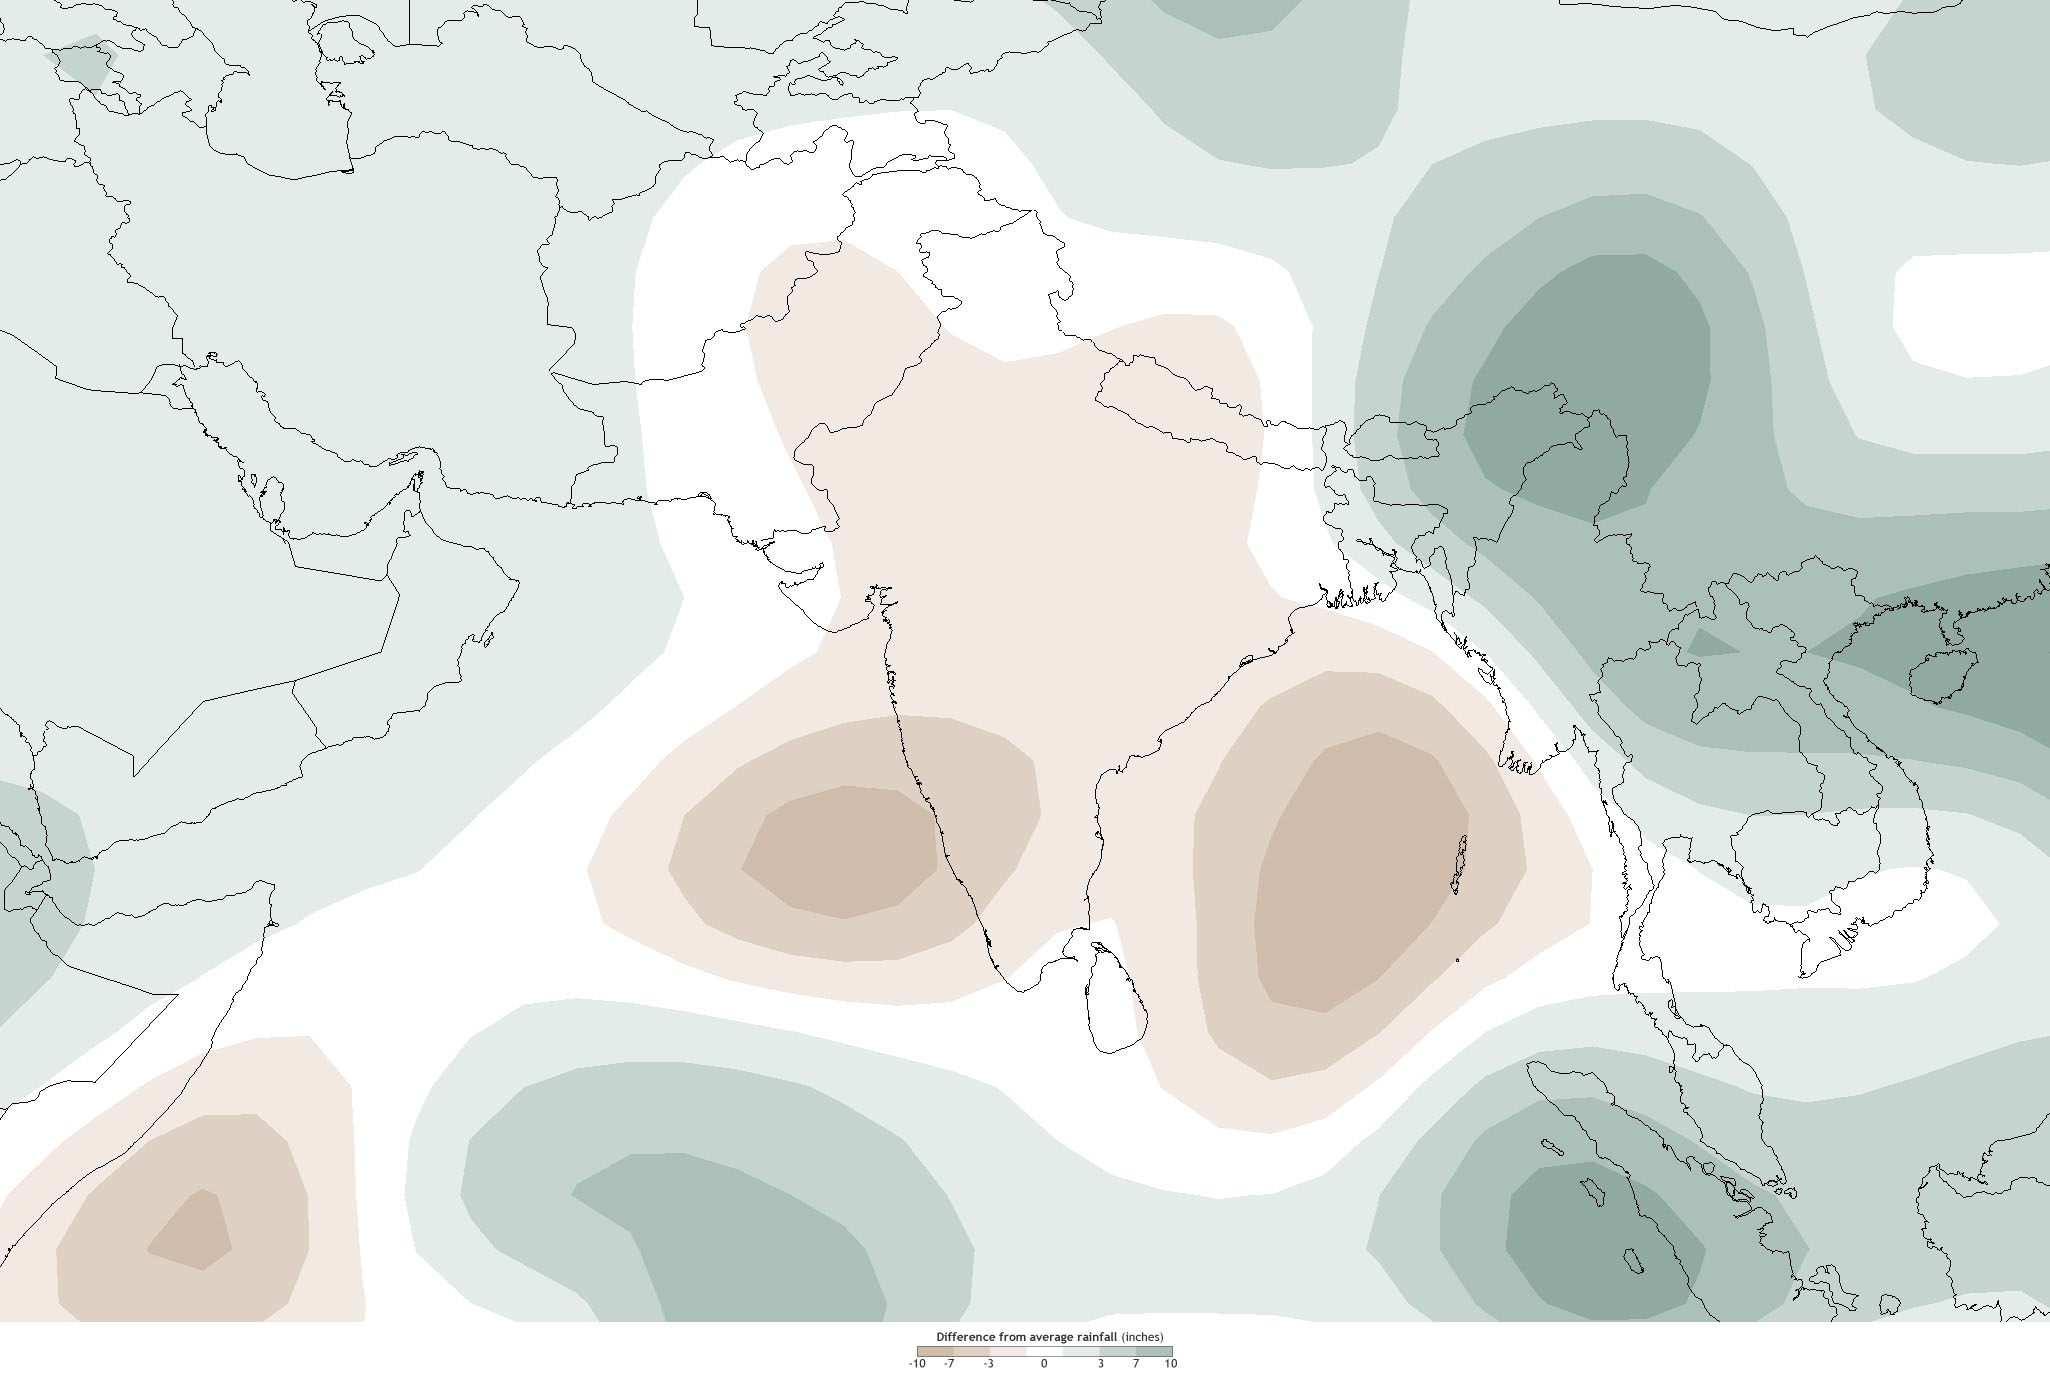
Image caption
Difference from average rainfall from June–July 2012 compared to the recent historical average (1981-2010). Greens indicate 3-10 inches more rain than average; brown indicate 3-10 inches less rain than average. (Map by Dan Pisut, NOAA Environmental Visualization Laboratory, based on NCEP reanalysis data from NOAA’s Earth System Research Laboratory.)