
Image caption
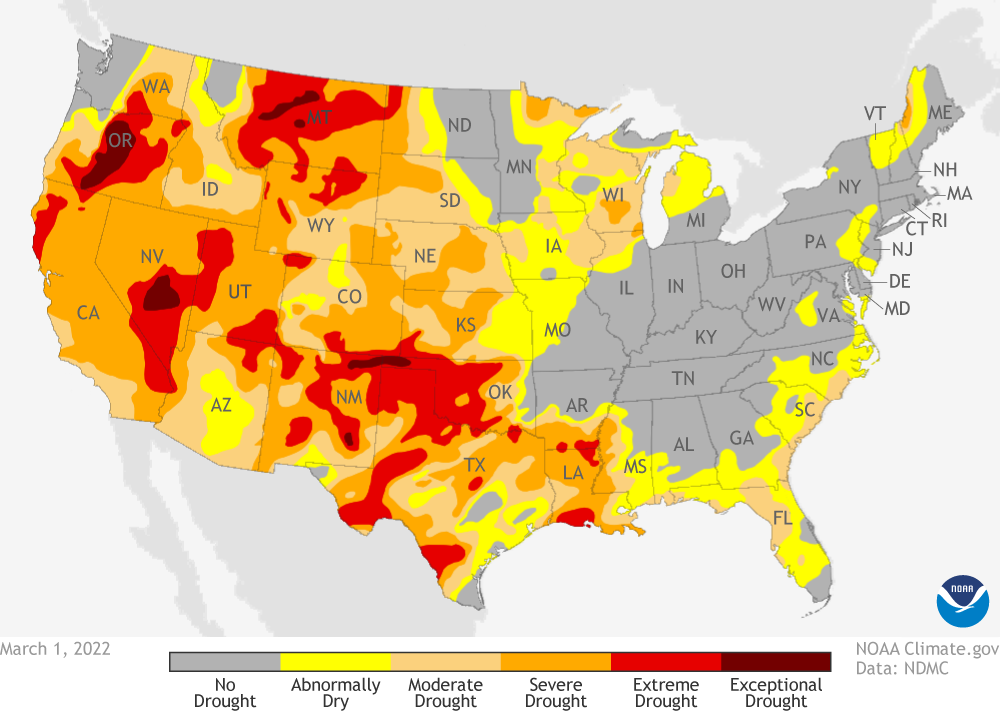
Drought conditions across the contiguous United States as of March 1, 2022. Drought intensity is shown by colors ranging from yellow (abnormally dry) to dark red (exceptional drought). NOAA Climate.gov map from Data Snapshots, based on data from NOAA National Centers for Environmental Information.