
Image caption
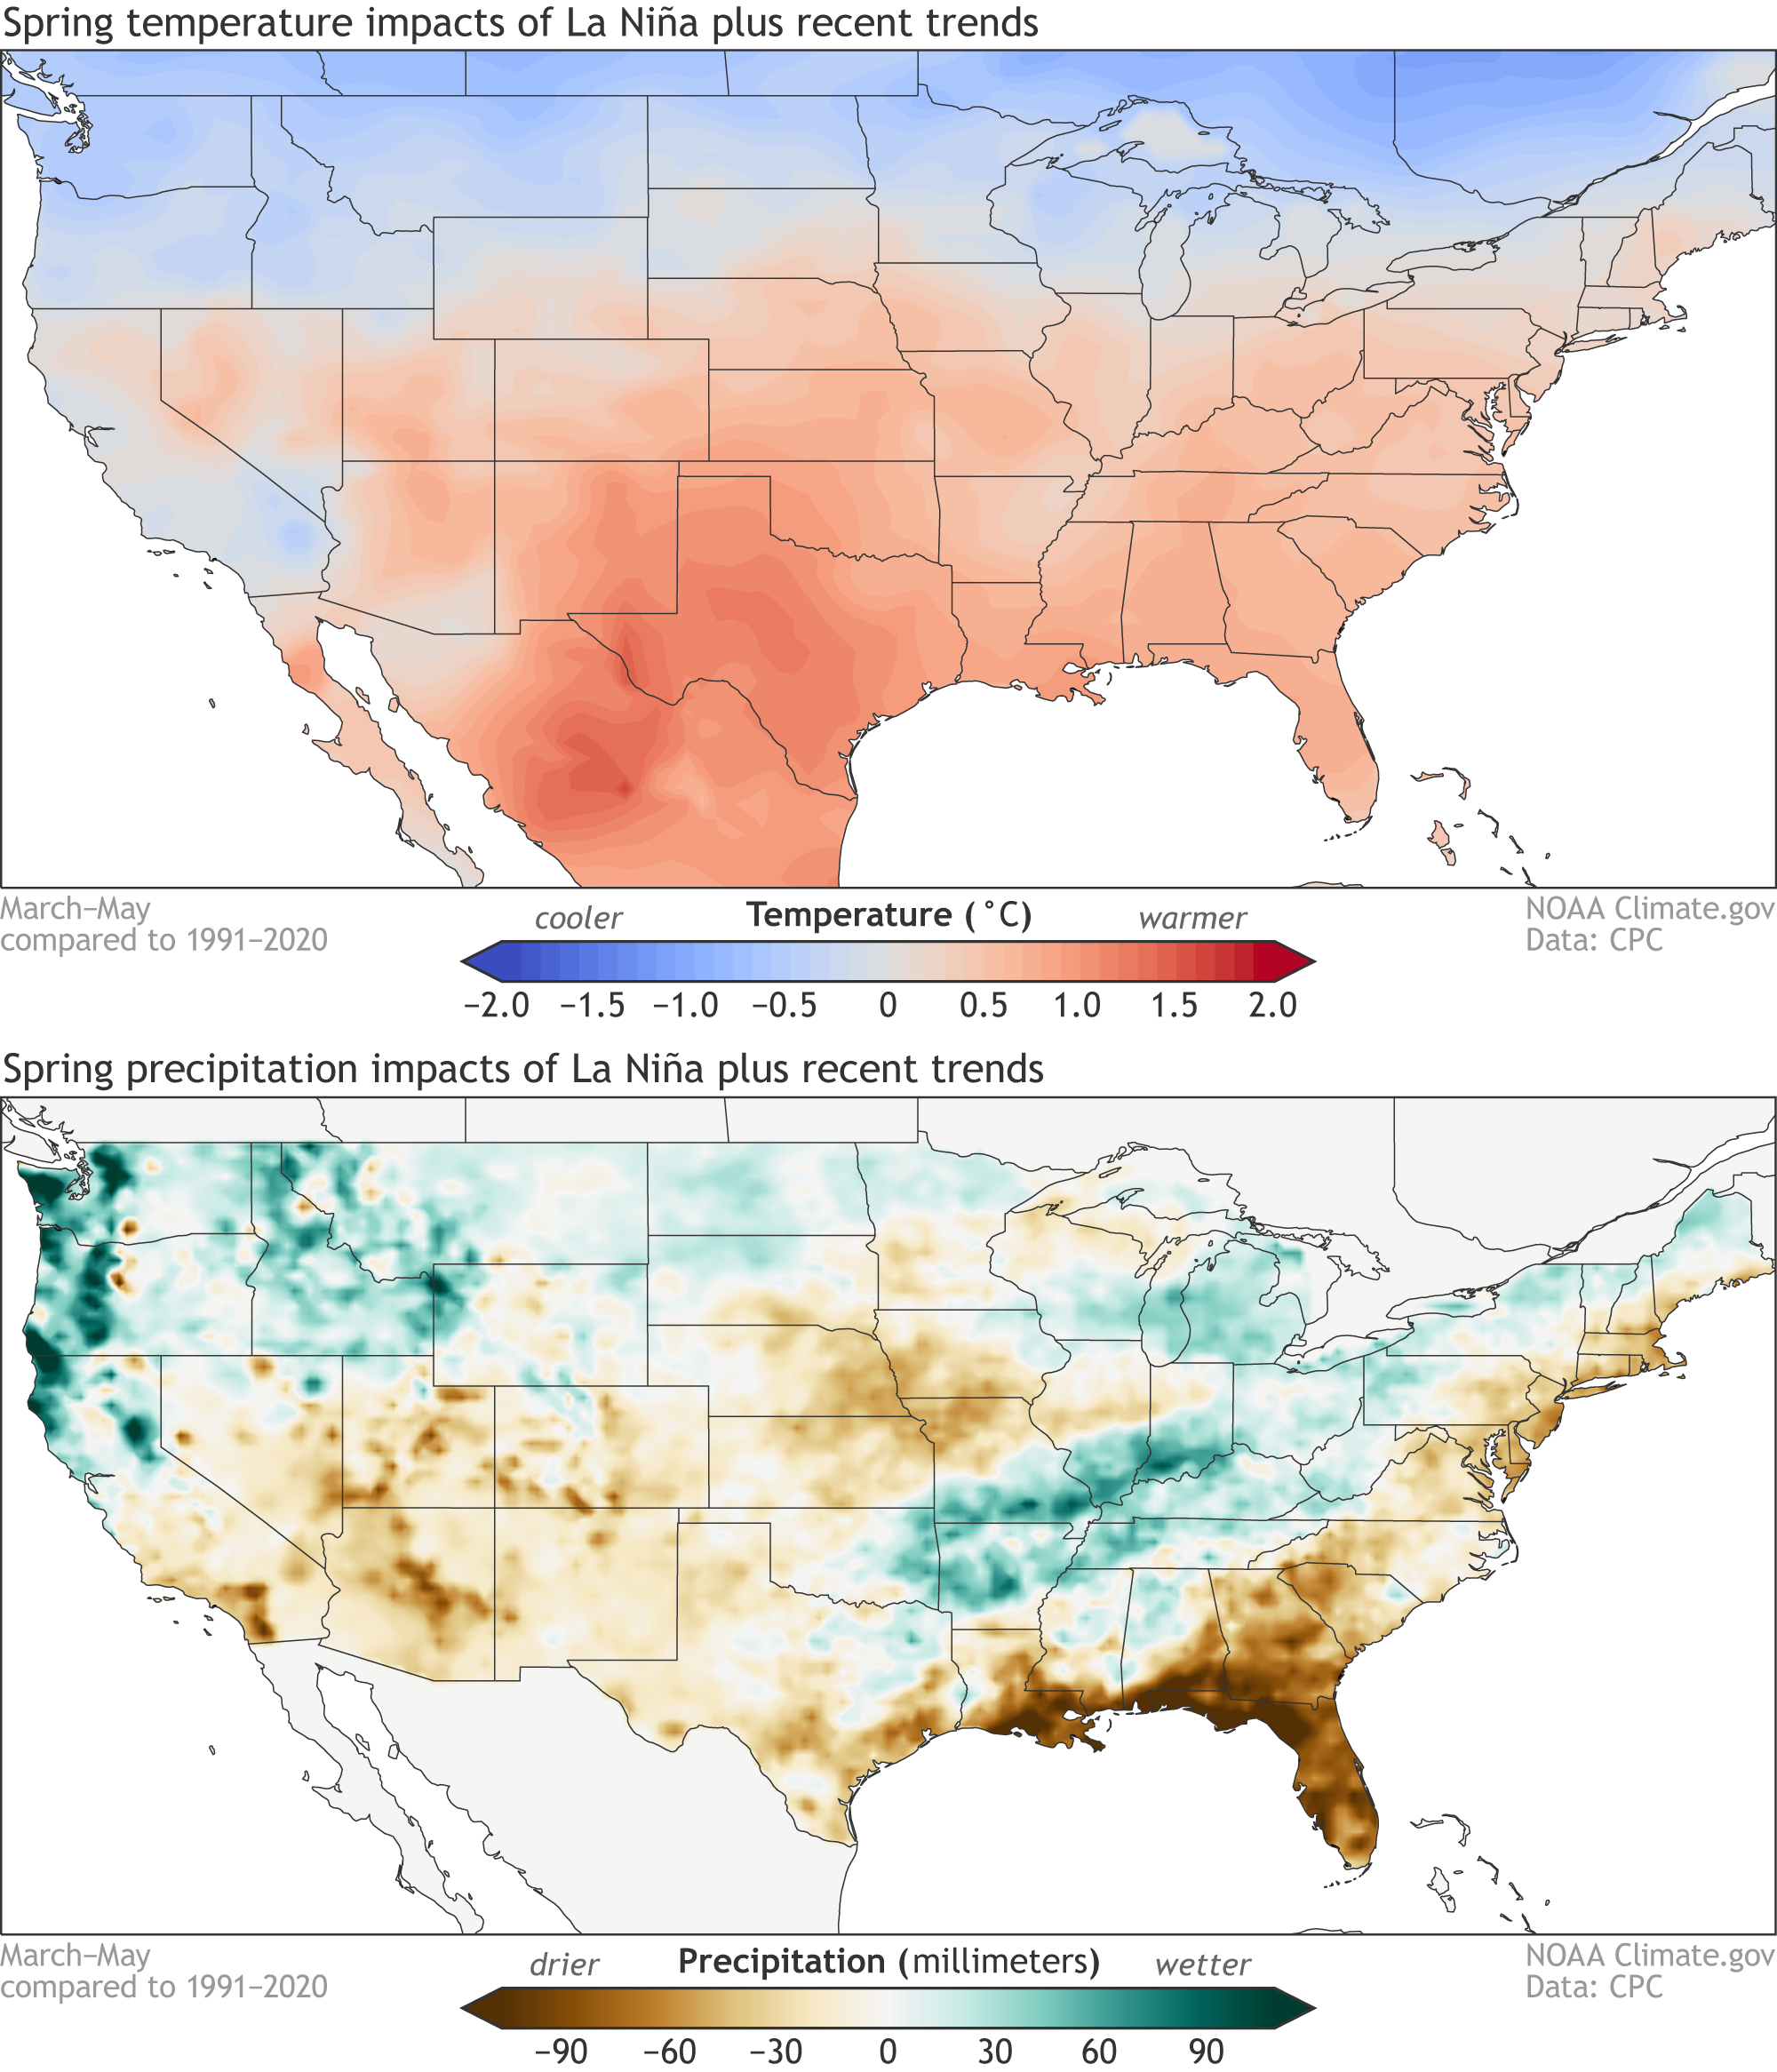
March-May average temperature (top) and precipitation (bottom) compared to the long-term average for the combination of historical La Niña events and climate trends. Data is based on the CPC ENSO composites and modified by Climate.gov.
This website is an ARCHIVED version of NOAA Climate.gov as of June 25, 2025.
Content is not being updated or maintained, and some links may no longer work.
March-May average temperature (top) and precipitation (bottom) compared to the long-term average for the combination of historical La Niña events and climate trends. Data is based on the CPC ENSO composites and modified by Climate.gov.