
Image caption
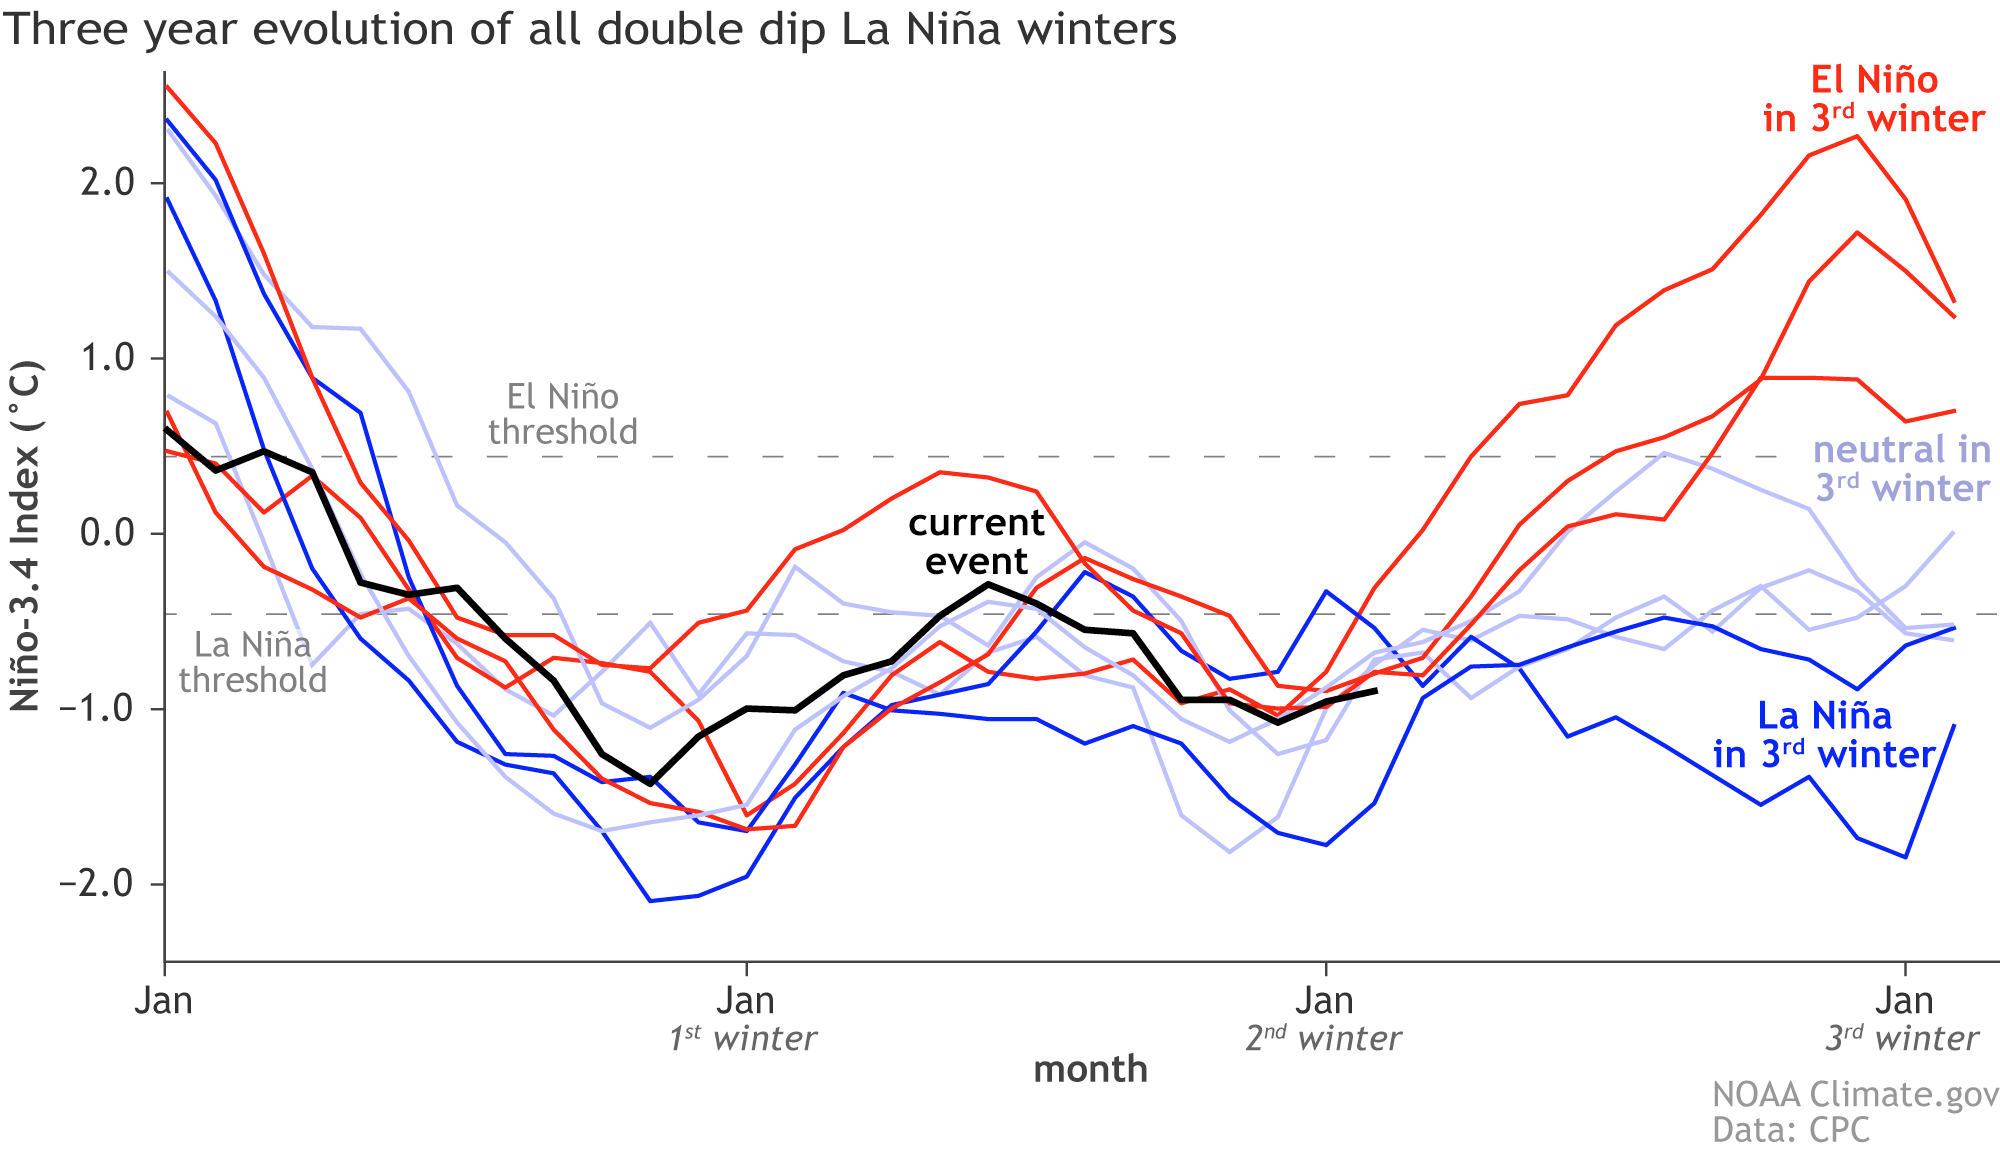
Three-year history of sea surface temperatures in the Niño-3.4 region of the tropical Pacific for 8 previous double-dip La Niña events. The color of the line indicates the state of ENSO for the third winter (red: El Niño, darker blue: La Niña, lighter blue: neutral). The black line shows the current event. Monthly Niño-3.4 index is from CPC using ERSSTv5. Time series comparison was created by Michelle L’Heureux, and modified by Climate.gov.