
Image caption
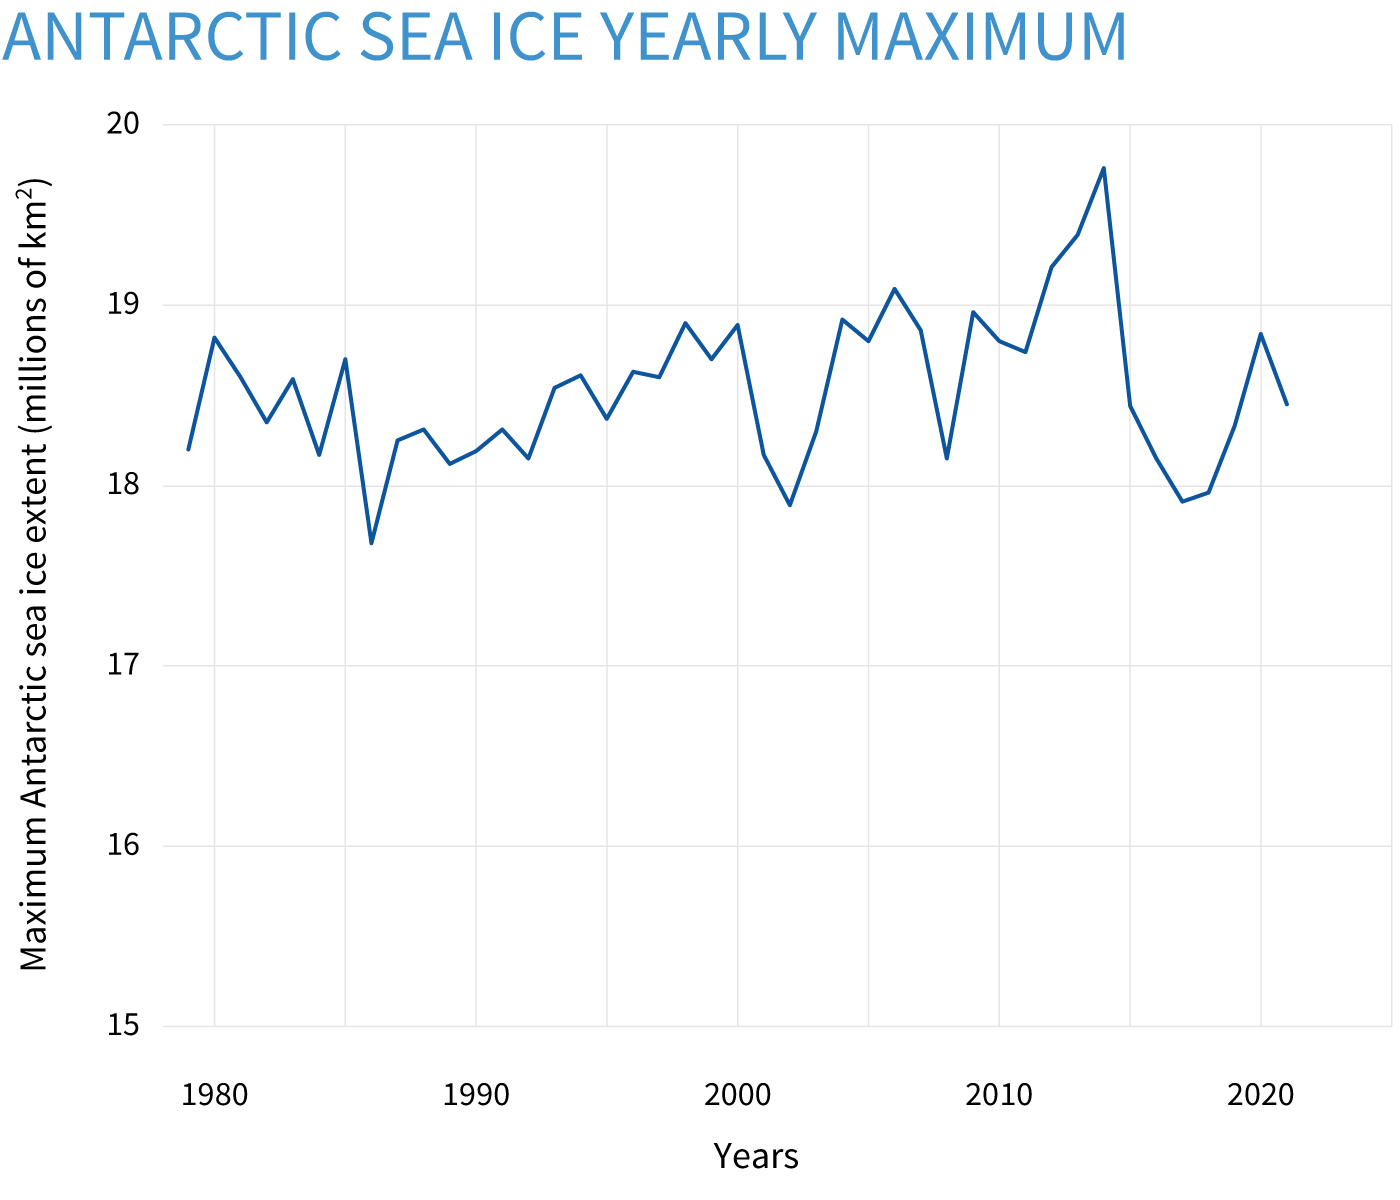
Antarctic sea ice extent each September from 1979 through 2021. Based on satellite data, extent is the total area where the ice concentration is 15 percent or higher. In the past decade, the September winter maximum has been extremely variable, hitting record and near-record highs as well as near-record lows. NOAA Climate.gov image, based on data from the National Snow and Ice Data Center.