
Image caption
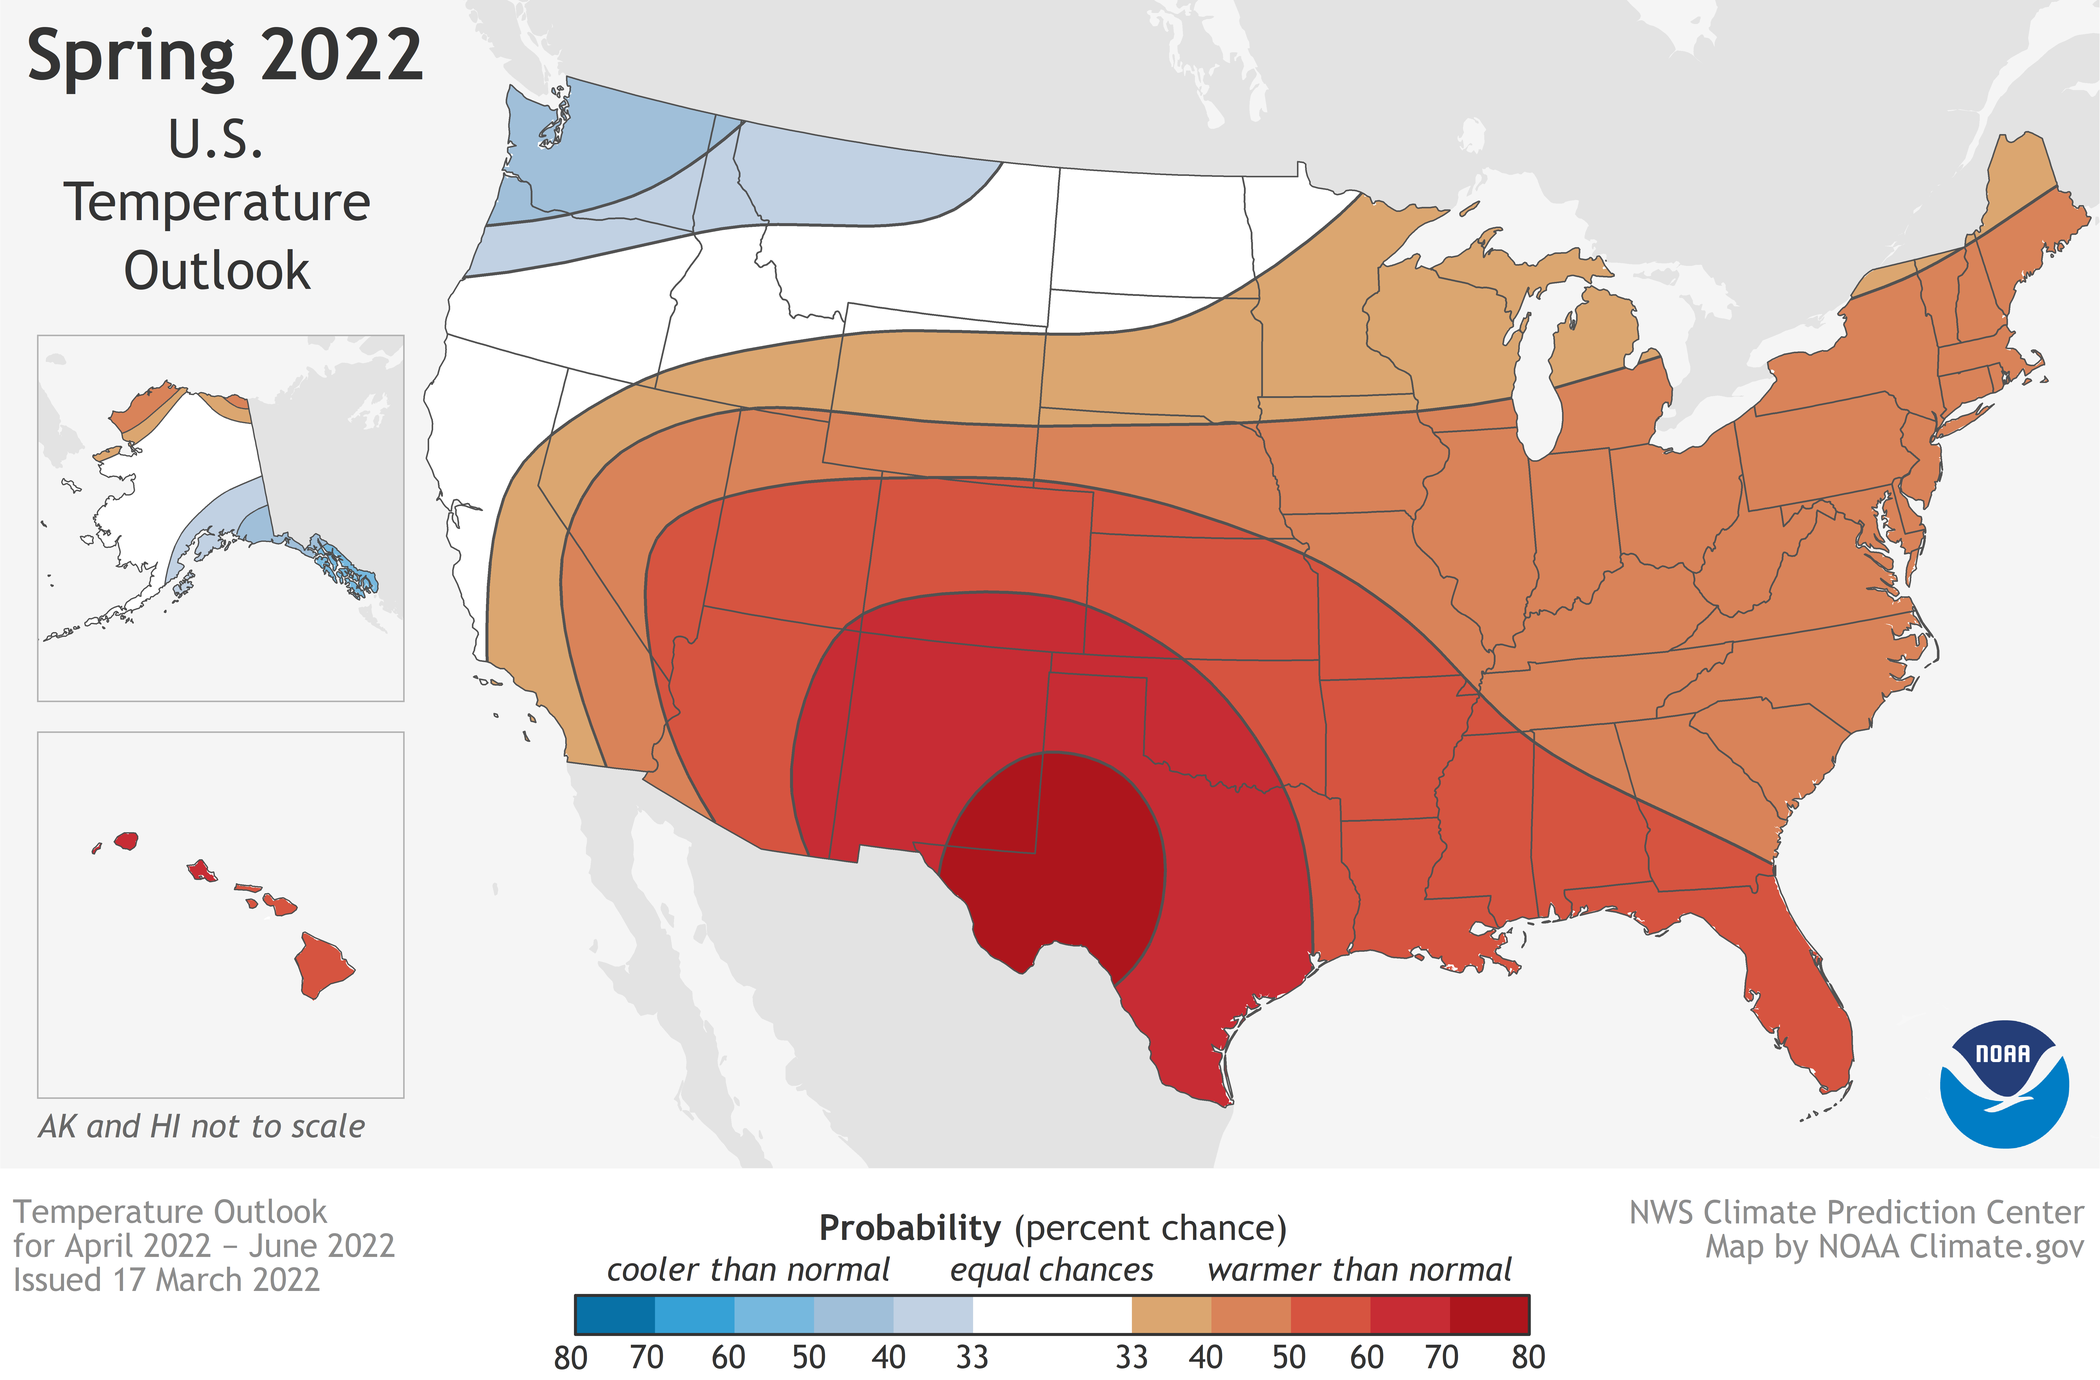
Map of the temperature outlook for the United States for April–June 2022, showing which locations have the highest chances for a much warmer (red) or much cooler (blue) than average spring. Darker colors mean higher chances, not more extreme temperatures. White does not mean average temperatures are forecast; it means that all three possible temperature outcomes (below normal, near normal, and above normal) are equally likely. NOAA Climate.gov maps, based on data from the Climate Prediction Center.