
Image caption
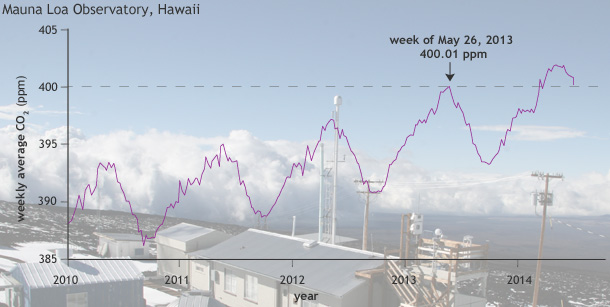
Weekly average concentration of carbon dioxide at Mauna Loa between 2010 and early 2014. Graph by NOAA Climate.gov, based on data provided by NOAA ESRL. Mauna Loa photo by Mary Miller, Exploratorium.
This website is an ARCHIVED version of NOAA Climate.gov as of June 25, 2025.
Content is not being updated or maintained, and some links may no longer work.
Weekly average concentration of carbon dioxide at Mauna Loa between 2010 and early 2014. Graph by NOAA Climate.gov, based on data provided by NOAA ESRL. Mauna Loa photo by Mary Miller, Exploratorium.